

Integrated genomic approaches implicate osteoglycin (Ogn) in the regulation of left ventricular mass
- PMID: 18443592
- PMCID: PMC2742198
- DOI: 10.1038/ng.134
Integrated genomic approaches implicate osteoglycin (Ogn) in the regulation of left ventricular mass
Abstract
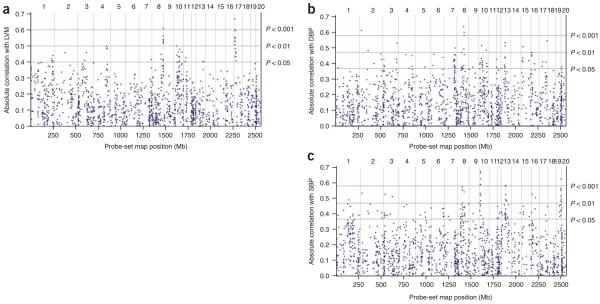
Left ventricular mass (LVM) and cardiac gene expression are complex traits regulated by factors both intrinsic and extrinsic to the heart. To dissect the major determinants of LVM, we combined expression quantitative trait locus1 and quantitative trait transcript (QTT) analyses of the cardiac transcriptome in the rat. Using these methods and in vitro functional assays, we identified osteoglycin (Ogn) as a major candidate regulator of rat LVM, with increased Ogn protein expression associated with elevated LVM. We also applied genome-wide QTT analysis to the human heart and observed that, out of 22,000 transcripts, OGN transcript abundance had the highest correlation with LVM. We further confirmed a role for Ogn in the in vivo regulation of LVM in Ogn knockout mice. Taken together, these data implicate Ogn as a key regulator of LVM in rats, mice and humans, and suggest that Ogn modifies the hypertrophic response to extrinsic factors such as hypertension and aortic stenosis.
Figures


Similar articles
-
Endonuclease G is a novel determinant of cardiac hypertrophy and mitochondrial function.Nature. 2011 Oct 5;478(7367):114-8. doi: 10.1038/nature10490. Nature. 2011. PMID: 21979051 Free PMC article.
-
Distinct QTLs are linked to cardiac left ventricular mass in a sex-specific manner in a normotensive inbred rat inter-cross.Mamm Genome. 2005 Sep;16(9):700-11. doi: 10.1007/s00335-005-0041-z. Epub 2005 Oct 20. Mamm Genome. 2005. PMID: 16245027
-
Genetic mapping of quantitative trait loci influencing left ventricular mass in rats.Am J Physiol Heart Circ Physiol. 2000 Nov;279(5):H2062-7. doi: 10.1152/ajpheart.2000.279.5.H2062. Am J Physiol Heart Circ Physiol. 2000. PMID: 11045938
-
Elevated plasma levels of osteoglycin in cardiovascular patients: a systematic review and meta-analysis.Ann Palliat Med. 2022 Feb;11(2):498-505. doi: 10.21037/apm-22-104. Ann Palliat Med. 2022. PMID: 35249327
-
The diverse functions of osteoglycin: a deceitful dwarf, or a master regulator of disease?FASEB J. 2016 Aug;30(8):2651-61. doi: 10.1096/fj.201500096R. Epub 2016 Apr 14. FASEB J. 2016. PMID: 27080639 Review.
Cited by
-
Identifying OGN as a Biomarker Covering Multiple Pathogenic Pathways for Diagnosing Heart Failure: From Machine Learning to Mechanism Interpretation.Biomolecules. 2024 Feb 2;14(2):179. doi: 10.3390/biom14020179. Biomolecules. 2024. PMID: 38397416 Free PMC article.
-
Transcriptome-wide co-expression analysis identifies LRRC2 as a novel mediator of mitochondrial and cardiac function.PLoS One. 2017 Feb 3;12(2):e0170458. doi: 10.1371/journal.pone.0170458. eCollection 2017. PLoS One. 2017. PMID: 28158196 Free PMC article.
-
Understanding cardiovascular disease: a journey through the genome (and what we found there).Dis Model Mech. 2012 Jul;5(4):434-43. doi: 10.1242/dmm.009787. Dis Model Mech. 2012. PMID: 22730474 Free PMC article. Review.
-
Transcriptome Profiling in Rat Inbred Strains and Experimental Cross Reveals Discrepant Genetic Architecture of Genome-Wide Gene Expression.G3 (Bethesda). 2016 Nov 8;6(11):3671-3683. doi: 10.1534/g3.116.033274. G3 (Bethesda). 2016. PMID: 27646706 Free PMC article.
-
Autoimmunoreactive IgGs from patients with postural orthostatic tachycardia syndrome.Proteomics Clin Appl. 2012 Dec;6(11-12):615-25. doi: 10.1002/prca.201200049. Epub 2012 Nov 8. Proteomics Clin Appl. 2012. PMID: 23002038 Free PMC article.
References
-
- Hubner N, et al. Integrated transcriptional profiling and linkage analysis for identification of genes underlying disease. Nat. Genet. 2005;37:243–253. - PubMed
-
- Passador-Gurgel G, Hsieh WP, Hunt P, Deighton N, Gibson G. Quantitative trait transcripts for nicotine resistance in Drosophila melanogaster. Nat. Genet. 2007;39:264–268. - PubMed
-
- Lorell BH, Carabello BA. Left ventricular hypertrophy: pathogenesis, detection, and prognosis. Circulation. 2000;102:470–479. - PubMed
-
- Devereux RB, et al. Relations of left ventricular mass to demographic and hemo-dynamic variables in American Indians: The Strong Heart Study. Circulation. 1997;96:1416–1423. - PubMed
Publication types
MeSH terms
Substances
Associated data
- Actions
Grants and funding
LinkOut - more resources
Full Text Sources
Other Literature Sources
Medical
Molecular Biology Databases
Miscellaneous
