. 2008 Nov;125(3):331-43.
doi: 10.1111/j.1365-2567.2008.02846.x. Epub 2008 Apr 26.

Widespread natural variation in murine natural killer T-cell number and function

Affiliations

Widespread natural variation in murine natural killer T-cell number and function

Stacia L Rymarchyk et al. Immunology. 2008 Nov.

Abstract

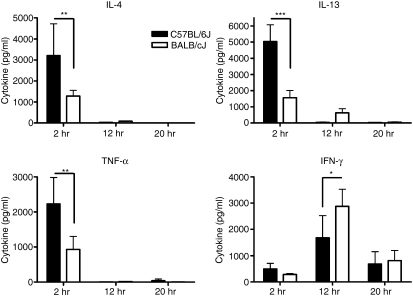
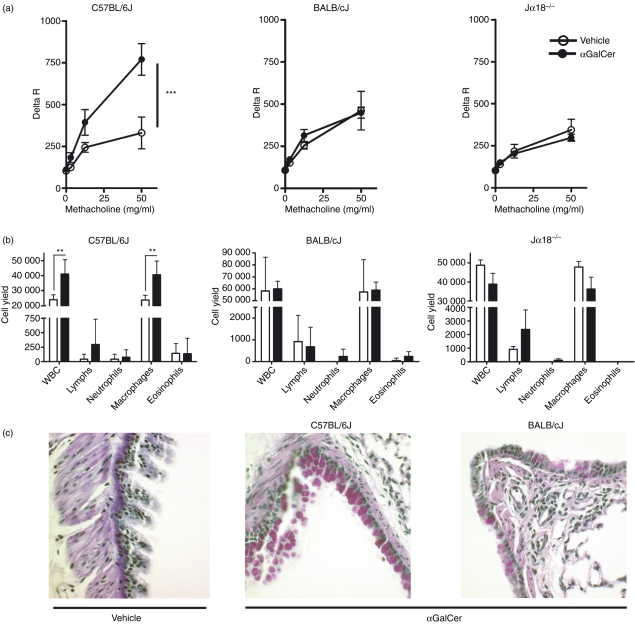
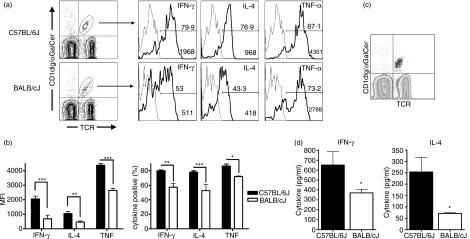
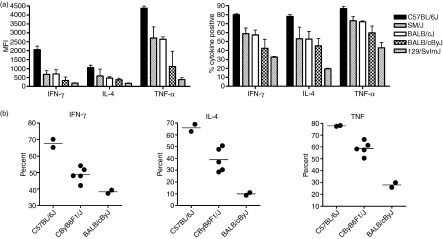
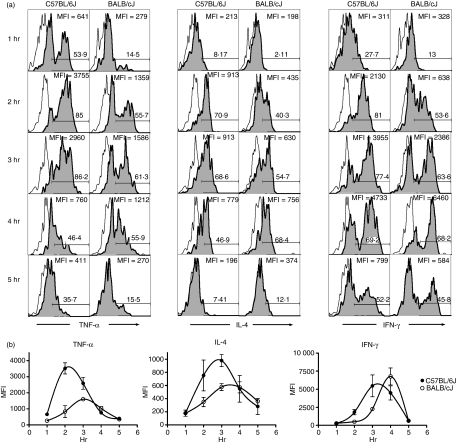
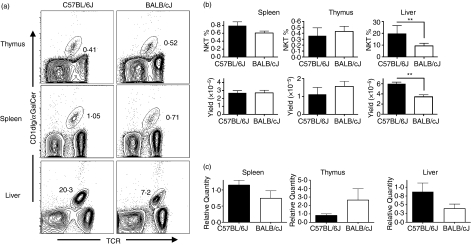
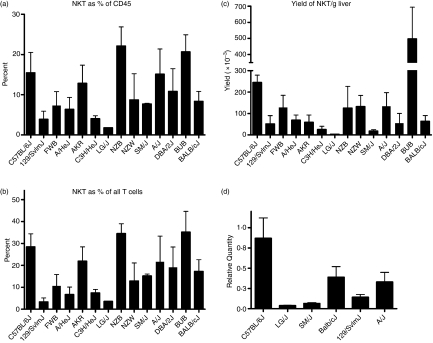
Natural killer T (NKT) cells comprise a novel T-lymphocyte subset that can influence a wide variety of immune responses through their ability to secrete large amounts of a variety of cytokines. Although variation in NKT-cell number and function has been extensively studied in autoimmune disease-prone mice, in which it has been linked to disease susceptibility, relatively little is known of the natural variation of NKT-cell number and function among normal inbred mouse strains. Here, we demonstrate strain-dependent variation in the susceptibility of C57BL/6J and BALB/cJ mice to NKT-mediated airway hyperreactivity, which correlated with significant increases in serum interleukin-4 (IL-4) and IL-13 elicited by the synthetic glycosphingolipid alpha-galactosylceramide. Examination of NKT-cell function revealed a significantly greater frequency of cytokine-producing NKT cells in C57BL/6J versus BALB/cJ mice as well as significant differences in the kinetics of NKT-cell cytokine production. Extension of this analysis to a panel of inbred mouse strains indicated that variability in NKT-cell cytokine production was widespread. Similarly, an examination of NKT-cell frequency revealed a significantly greater number of liver NKT cells in the C57BL/6J mice versus BALB/cJ mouse livers. Again, examination of a panel of inbred mouse strains revealed that liver NKT-cell numbers were quite variable, spanning over a 100-fold range. Taken together, these results demonstrate the presence of widespread natural variation in NKT-cell number and function among common inbred mouse strains, which may have implications for the examination of the influence of NKT cells in immune responses and disease pathogenesis among different genetic backgrounds.


Figures

Figure 1
Figure 1
Serum cytokine production in αGalCer-treated C57BL/6J and BALB/cJ mice. Eight-week-old female C57BL/6J and BALB/cJ mice were given αGalCer (100 ng/g) or vehicle only (0·05% Tween-20) intraperitoneally. Serum from blood collected at various times after injection was assayed for cytokines. Each time-point represents the mean ± SD of five mice, *P < 0·05, **P < 0·01, ***P < 0·001. The data are representative of three separate experiments.
Figure 2
Figure 2
Genetic background controls susceptibility to natural killer T (NKT) cell-mediated airway hyperreactivity (AHR). Eight-week-old female mice were injected with αGalCer (100 ng/g) or vehicle control intraperitoneally followed by assessment of lung function and pathology 20 hr later. (a) AHR in C57BL/6J but not BALB/cJ mice. Mice administered either αGalCer (closed circles) or vehicle control (open circles) were tested for hyperresponsiveness to methacholine. Data represent the mean ± SEM from five to nine mice per group, ***P = 0·0001. (b) Differential cell counts from bronchoalveolar lavage (BAL). Analysis of BAL cell differentials revealed an increased number of leucocytes, primarily macrophages from C57BL/6J mice treated with αGalCer versus vehicle. No increases were observed in αGalCer-treated BALB/cJ or Jα18−/− mice. Data represent the mean ± SD from five to nine mice per group. (c) Increased periodic acid–Schiff (PAS) staining in lungs of αGalCer-treated C57BL/6J mice. Sections of lungs from αGalCer-treated or vehicle-treated C57BL/6J and BALB/cJ mice were harvested 20 hr after treatment, fixed, and PAS-stained. Data are representative of multiple sections from two C57BL/6J and two BALB/cJ mice for each treatment.
Figure 3
Figure 3
Strain-dependent variation in natural killer T (NKT) cell intracellular cytokine production. Eight-week-old female mice were administered αGalCer (100 ng/g) intraperitoneally. Two hours after injection, intracellular staining was used to analyse cytokine production in splenic NKT cells. (a) Intracellular cytokine expression in C57BL/6J and BALB/cJ spleen NKT cells. Splenocytes were stained with fluorescein isothiocyanate (FITC) anti-T-cell receptor monoclonal antibody (mAb), phycoerythrin αGalCer-loaded CD1dIg, and Alexa647 anti-cytokine or isotype control mAbs. Histograms depict the intracellular cytokine staining of NKT cells with isotype control mAb (grey lines) or with anti-cytokine mAb (black lines). The percentage of cytokine-positive cells is indicated above the gate. The median fluorescence intensity (MFI) of the NKT-gated population is depicted in the lower right corner. (b) Cumulative cytokine expression data in C57BL/6J versus BALB/cJ spleen. Data are presented as the mean MFI ± SD of the NKT-gated populations as well as the mean percent cytokine-positive NKT cells (± SD), n = 3 mice. Data are representative of five separate experiments. (c) Backgate analysis of tumour necrosis factor-α (TNF-α)-producing cells after αGalCer administration reveals that NKT cells are the exclusive producers of this cytokine 2 hr after αGalCer injection. The grey contour plot depicts TCR+αGalCer-CD1dIg+ splenocytes over which is overlaid all TNF-α-producing cells (large black dots). (d) Ex vivo cytokine production by splenocytes from αGalCer-treated C57BL/6J and BALB/cJ mice. Splenocytes from αGalCer-treated mice were placed in short-term culture, without any additional stimulation, after which cytokines were measured by enzyme-linked immunosorbent assay (ELISA), n = 2 mice per strain. Data are representative of two separate experiments, *P < 0·05, **P < 0·01, ***P < 0·001.
Figure 4
Figure 4
Variation of natural killer T (NKT) cell cytokine production among different genetic backgrounds. Intracellular cytokine staining was performed on different strains of mice 2 hr after αGalCer administration using the methods described in Fig. 3. (a) Strain-dependent variation in the NKT-cell cytokine production among five different strains of mice. Cumulative cytokine expression of interferon-γ (IFN-γ), tumour necrosis factor-α (TNF-α) and interleukin-4 (IL-4) are shown. Data are presented as the mean ± SD median fluorescence intensity of the NKT-gated populations as well as the mean ± SD per cent cytokine-positive NKT cells, n = 3 mice. Significant variation among strains was observed, P < 0·0001. Data are representative of two independent experiments. (b) Inheritance pattern of NKT-cell cytokine expression. Eight-week-old female C57BL/6J, BALB/cByJ, and CByB6/J F1 mice were given αGalCer (100 ng/g) intraperitoneally. Two hours after injection, intracellular staining was used to analyse cytokine production in the spleen. Each data point represents one mouse.
Figure 5
Figure 5
Strain-dependent variation in the kinetics of intracellular cytokine production. Intracellular cytokine staining was used to assess cytokine production by natural killer T (NKT) cells at various times after αGalCer administration. (a) Representative histograms of NKT-gated splenocytes stained with isotype control monoclonal antibody (mAb; open histogram) or anti-cytokine mAb (shaded histogram) at various times after injection. The percentage of cytokine-positive NKT cells is depicted above the gate as is the MFI of the NKT-gated 2population. (b) Comparison of intracellular cytokine production kinetics between strains. The MFIs of NKT-cell intracellular tumour necrosis factor-α (TNF-α), interleukin-4 (IL-4) and interferon-γ (IFN-γ) were plotted against time. Data represent the mean MFI ± SD of two to four mice per time-point and are representative of two independent experiments.
Figure 6
Figure 6
Strain-dependent variation in liver natural killer T (NKT)-cell frequency. Thymus, spleen and liver cell preparations from 8-week-old female C57BL/6J and BALB/cJ mice were stained with phycoerythrin-Cy5 anti-CD45, fluorescein iosthiocyanate (FITC) anti-T-cell receptor (TCR), and phycoerythrin αGalCer-loaded CD1dIg. (a) Representative contour plots of NKT-cell percentages in the different organs. Data depicted are the CD45-gated subset. (b) NKT-cell percentages and yields from each organ. Data are presented as the mean ± SD, **P < 0·01, n = 3 to n = 5 mice per organ. (c) Quantitative reverse transcription–polymerase chain reaction (RT-PCR) of invariant NKT TCR transcripts. Quantitative RT-PCR was performed on cDNAs using primers and probes specific for the NKT invariant TCR-α chain. RNA levels were normalized to 18S RNA endogenous control. Amounts of normalized TCR-α transcripts is expressed as the relative quantity compared to that of C57BL/6J mice.
Figure 7
Figure 7
Variation in liver natural killer T (NKT) -cell frequency among different genetic backgrounds. Intrahepatic lymphocytes (IHLs) purified from a panel of 14 strains of mice, were stained and analysed by flow cytometry. NKT-cell frequencies are reported as (a) percentage of CD45+ cells, (b) percentage of TCR+ cells, and (c) yield/g liver. Data are the mean ± SD of three to five mice per strain. Significant variation was observed in both the frequency as well as the number of NKT cells, P < 0·001. (d) Widespread variability in NKT TCR-α transcript levels. Relative levels of invariant VA14 NKT TCR-α chain transcripts, used as surrogate markers of NKT-cell numbers in different organs, were assessed in the spleen, liver, and thymus from selected strains of mice by quantitative reverse transcription–polymerase chain reaction.

References

    1. Kronenberg M. Toward an understanding of NKT cell biology: progress and paradoxes. Annu Rev Immunol. 2005;23:877–900. - PubMed
    1. Kawano T, Cui J, Koezuka Y, et al. CD1d-restricted and TCR-mediated activation of valpha14 NKT cells by glycosylceramides. Science. 1997;278:1626–9. - PubMed
    1. Brigl M, Bry L, Kent SC, Gumperz JE, Brenner MB. Mechanism of CD1d-restricted natural killer T cell activation during microbial infection. Nat Immunol. 2003;4:1230–7. - PubMed
    1. Stanic AK, De Silva AD, Park JJ, et al. Defective presentation of the CD1d1-restricted natural Vα14Jα18 NKT lymphocyte antigen caused by beta-d-glucosylceramide synthase deficiency. Proc Natl Acad Sci USA. 2003;100:1849–54. - PMC - PubMed
    1. Paget C, Mallevaey T, Speak AO, et al. Activation of invariant NKT cells by toll-like receptor 9-stimulated dendritic cells requires type I interferon and charged glycosphingolipids. Immunity. 2007;27:597–609. - PubMed

Publication types

LinkOut - more resources