. 2008 May 6;105(18):6632-7.
doi: 10.1073/pnas.0800970105. Epub 2008 Apr 29.

Phenotypic transcription factors epigenetically mediate cell growth control

Affiliations

Phenotypic transcription factors epigenetically mediate cell growth control

Syed A Ali et al. Proc Natl Acad Sci U S A. .

Abstract

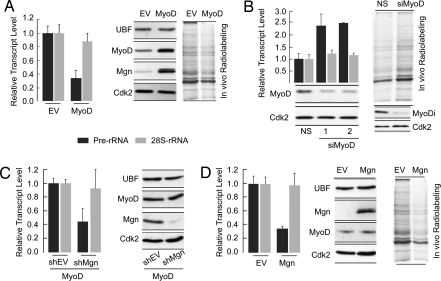
Ribosomal RNA (rRNA) genes are down-regulated during osteogenesis, myogenesis, and adipogenesis, necessitating a mechanistic understanding of interrelationships between growth control and phenotype commitment. Here, we show that cell fate-determining factors [MyoD, myogenin (Mgn), Runx2, C/EBPbeta] occupy rDNA loci and suppress rRNA expression during lineage progression, concomitant with decreased rRNA expression and reciprocal loss of occupancy by c-Myc, a proliferation-specific activator of rRNA transcription. We find interaction of phenotypic factors with the polymerase I activator upstream binding factor UBF-1 at interphase nucleoli, and this interaction is epigenetically retained on mitotic chromosomes at nucleolar organizing regions. Ectopic expression and RNA interference establish that MyoD, Mgn, Runx2, and C/EBPbeta each functionally suppress rRNA genes and global protein synthesis. We conclude that epigenetic control of ribosomal biogenesis by lineage-specific differentiation factors is a general developmental mechanism for coordinate control of cell growth and phenotype.


Conflict of interest statement

The authors declare no conflict of interest.

Figures

Fig. 1.
Fig. 1.
rRNA expression is down-regulated during mesenchymal cell differentiation. C2C12 cells were differentiated into either myoblast (A and B) or osteoblast (C and D) lineages, whereas 3T3-L1 cells were used for adipocyte differentiation (E and F). Cells were harvested at the indicated time points (i.e., days 0, 1, and 2). (A) Quantitative PCR analysis showed that both premature rRNA (○) and mature rRNA (●) levels were decreased during differentiation of all three lineages (A, C, and E). Western blot analysis confirmed the temporal expression of differentiation-related proteins specific for each lineage; MyoD and Mgn were upregulated during skeletal muscle differentiation (B), Runx2 expression increased during osteogenesis (D), and C/EBPα and β were induced during adipocyte differentiation (F). In contrast, expression of proliferation related proteins [e.g., Myc and cyclin A (CycA)] decreased as cells committed to various lineages, whereas levels of the rRNA transcriptional activator UBF remained unaltered. LaminB1 was used as a control for protein loading (B, D, and F).
Fig. 2.
Fig. 2.
Lineage-specific transcription factors occupy ribosomal DNA repeats in vivo. (A) Ribosomal DNA repeats contain binding sites for osteogenic Runx2 (▿), adipogenic C/EBP (●), and myogenic MyoD and Mgn (▴) transcription factors. Arrows indicate positions of ChIP primers used in this study. (B) ChIP assay using primer sets A and B showed sequential rDNA occupancy by MyoD (○) and Mgn (●) that is consistent with their temporal expression during myogenic differentiation of C2C12 cells. In contrast, the osteogenic Runx2 factor (◆) did not associate with rDNA repeats during muscle cell differentiation. No DNA was amplified from samples precipitated with IgG (◇). (C) When C2C12 cells were differentiated into osteoblasts by bone morphogenetic protein-2 treatment, the rDNA occupancy by Runx2 at regions A and B was increased, with a concomitant decrease in association of MyoD and Mgn with rDNA. (D) Binding of C/EBPβ (Δ) is increased at regions A and C of the rDNA locus during adipocyte differentiation of 3T3-L1 cells.
Fig. 3.
Fig. 3.
Colocalization and interaction of MyoD and Mgn with UBF-1 increase during myogenesis. (A and B) (Left) Actively proliferating C2C12 cells, cultured on gelatin-coated coverslips, were differentiated into myotubes and analyzed for colocalization of MyoD and Mgn with UBF-1 at days 0, 1, and 2 by using IF microscopy. Percentages shown within the images indicate percent of UBF-1 foci that colocalize with MyoD or Mgn. (Right) Images reflect nine Z-sections of a representative nucleolus where MyoD or Mgn colocalize with UBF-1 (marked by yellow boxes). (A) MyoD and UBF-1 colocalization increased from day 0 to day 1 and persisted through day 2. Deconvolved images of interphase nuclei immunostained with MyoD (green) and UBF-1 (red) at various days of muscle differentiation are presented. (B) The colocalization between UBF-1 (red) and Mgn (green) is only observed at day 2 as Mgn is undetectable at days 0 and 1. (C and D) UBF-1 sequentially interacts with MyoD (C) and Mgn (D) during myoblast differentiation. MyoD and Mgn were immunoprecipitated at various days of muscle differentiation with specific antibodies or IgG as a control. Five percent of total cell lysates was used as input. Immunoprecipitates were resolved by SDS/PAGE followed by Western blot analysis. Membranes were then incubated with specific antibodies against UBF-1 or MyoD and Mgn.
Fig. 4.
Fig. 4.
MyoD colocalizes with UBF-1 at NORs during mitosis. Actively proliferating C2C12 cells, grown on gelatin-coated coverslips, were immunostained with MyoD (green) and UBF-1 (red), and counterstained with DAPI to visualize chromosomes. (Top) Cells were captured at different stages of mitosis. (Middle) Sections of representative NORs (shown by white boxes in Top) where MyoD localizes during mitosis are taken through the Z-plane. Numbers within each image indicate Z-sections from top (1) to bottom (9) of the cells. (Bottom) Colocalization of MyoD with UBF-1 is quantified by using the Line Scan function of the MetaMorph imaging software. Line graphs represent an average of colocalization between the two proteins through all Z-sections shown in Middle. The y axis shows pixel intensity of each signal, and the x axis represents length of the area scanned in pixels.
Fig. 5.
Fig. 5.
Myogenic transcription factors MyoD and Mgn suppress rRNA gene transcription and global protein synthesis. (A) Actively proliferating C2C12 were infected with either vector backbone (EV) or MyoD retrovirus for 48 h. Cells were harvested for RT-PCR and Western blot analyses or were subjected to in vivo radio-labeling to assess global protein synthesis. For quantitative RT-PCR analysis, total cellular RNA was isolated from an equal number of cells to determine the effect of MyoD overexpression on rRNA transcription. Bar graphs represent rRNA levels normalized to EF-1α. Western blots show ectopic expression of MyoD. As expected, MyoD overexpression induced Mgn, whereas UBF-1 levels remained unaltered. Levels of Cdk2 are shown as control for protein loading. Cells were also metabolically labeled for 30 min with 35S-labeled amino acid mix to assess the effect of MyoD overexpression on global protein synthesis. (B) MyoD was down-regulated by two independent siRNA oligos (siMyoD 1 and 2). Each oligo reduced MyoD protein levels without affecting Cdk2, which was used a control for protein loading. Bar graphs show an increase in pre-rRNA transcript levels (normalized to EF-1 α), when MyoD was down-regulated by RNA interference. Mature 28S-rRNA remained unaltered. The autoradiograph shows increased global protein synthesis upon down-regulation of MyoD by a smart pool of four siRNA oligos against MyoD (Dharmacon). (C) Contribution of Mgn to the MyoD-mediated suppression of rRNA transcription was assessed by down-regulating MyoD-induced Mgn expression by shRNA. Cells infected with MyoD retrovirus were also transfected with either vector backbone (shEV) or shRNA against Mgn. Quantitative PCR analysis shows that MyoD-mediated suppression of rRNA transcription remained unaffected in the absence of Mgn. Down-regulation of Mgn was confirmed by Western blot analysis; shMgn had no effect on the protein levels of UBF-1, MyoD, or Cdk2. (D) Mgn was overexpressed in C2C12 cells by retroviral infection, and equal numbers of cells infected with vector backbone (EV) or Mgn retrovirus were analyzed for rRNA transcription, protein expression, or global protein synthesis. Bar graphs represent rRNA transcript levels normalized to EF1-α.
Fig. 6.
Fig. 6.
Osteogenic Runx2 and adipogenic C/EBPβ transcription factors down-regulate rRNA transcription. (A) Actively proliferating C2C12 were infected with vector backbone (EV) or Runx2 adenovirus for 48 h. (B) Similarly, adipogenic 3T3-L1 cells were infected with vector backbone (EV) or C/EBPβ retrovirus. Bar graphs represent rRNA levels normalized with EF-1-α. Western blots show the expression of Runx2 (A) or C/EBPβ (B) and UBF-1 and Cdk2 (A and B).

Similar articles

Cited by

References

    1. Hernandez-Verdun D, Roussel P. Regulators of nucleolar functions. Prog Cell Cycle Res. 2003;5:301–308. - PubMed
    1. Klein J, Grummt I. Cell cycle-dependent regulation of RNA polymerase I transcription: The nucleolar transcription factor UBF is inactive in mitosis and early G1. Proc Natl Acad Sci USA. 1999;96:6096–6101. - PMC - PubMed
    1. Grigoriadis AE, Heersche JNM, Aubin JE. Differentiation of muscle, fat, cartilage, and bone from progenitor cells present in a bone-derived clonal cell population: Effect of dexamethasone. J Cell Biol. 1988;106:2139–2151. - PMC - PubMed
    1. Katagiri T, et al. Bone morphogenetic protein-2 converts the differentiation pathway of C2C12 myoblasts into the osteoblast lineage. J Cell Biol. 1994;127:1755–1766. - PMC - PubMed
    1. Lee MH, et al. Transient up-regulation of CBFA1 in response to bone morphogenetic protein-2 and transforming growth factor β1 in C2C12 myogenic cells coincides with suppression of the myogenic phenotype but is not sufficient for osteoblast differentiation. J Cell Biochem. 1999;73:114–125. - PubMed

Publication types

MeSH terms

LinkOut - more resources