. 2008 Jul;233(7):860-73.
doi: 10.3181/0801-RM-12. Epub 2008 Apr 29.

Forced expression of MMP9 rescues the loss of angiogenesis and abrogates metastasis of pancreatic tumors triggered by the absence of host SPARC

Affiliations

Forced expression of MMP9 rescues the loss of angiogenesis and abrogates metastasis of pancreatic tumors triggered by the absence of host SPARC

Shanna Arnold et al. Exp Biol Med (Maywood). 2008 Jul.

Abstract

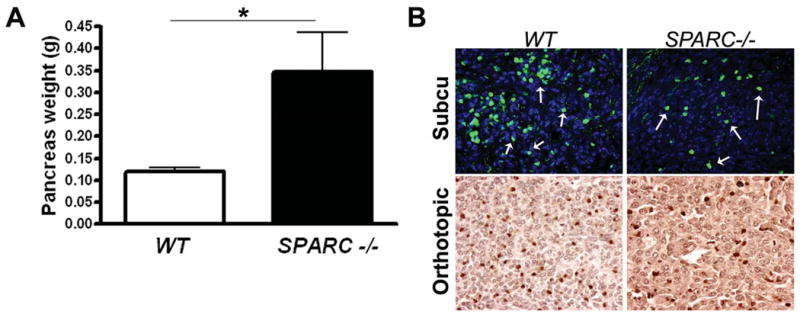
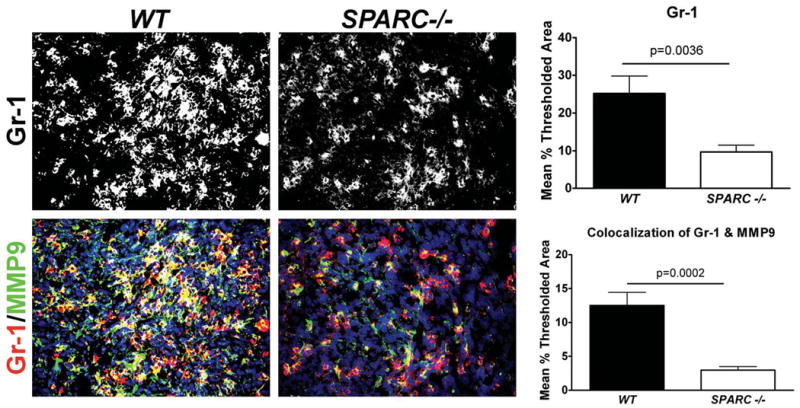
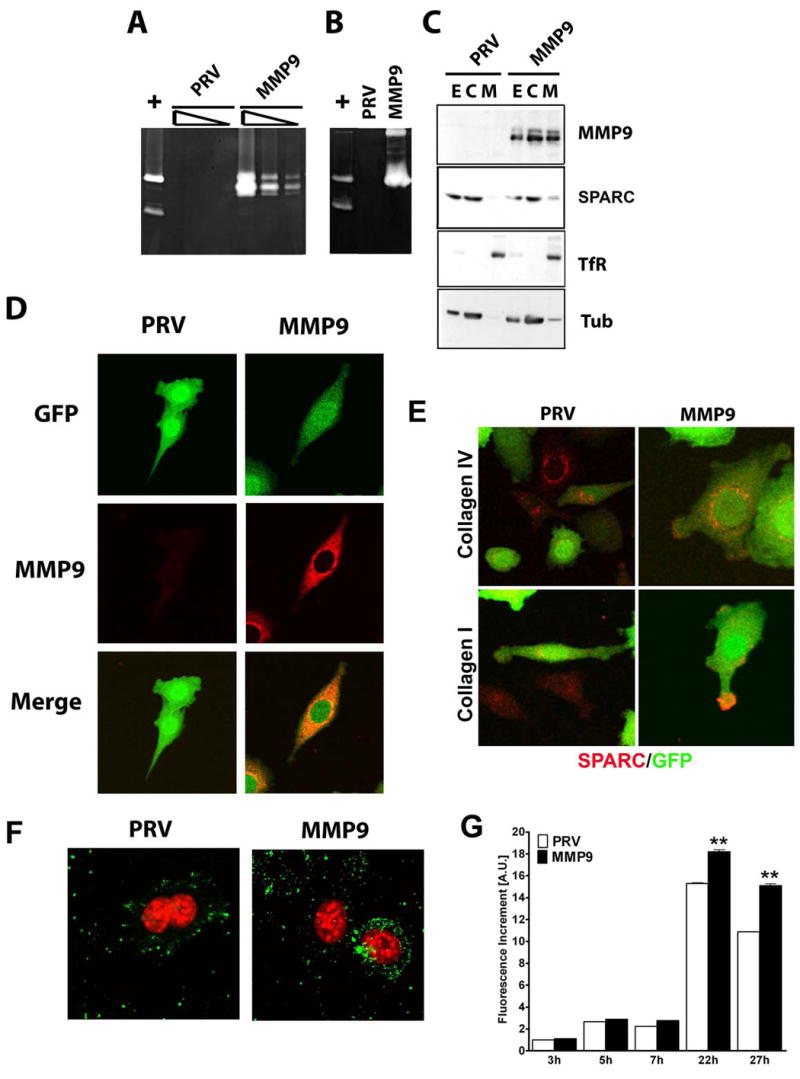
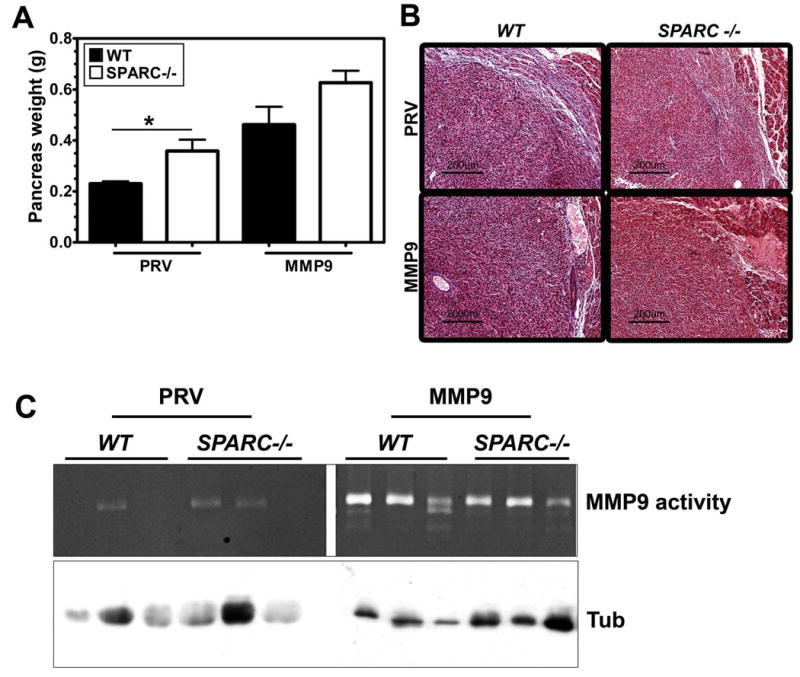
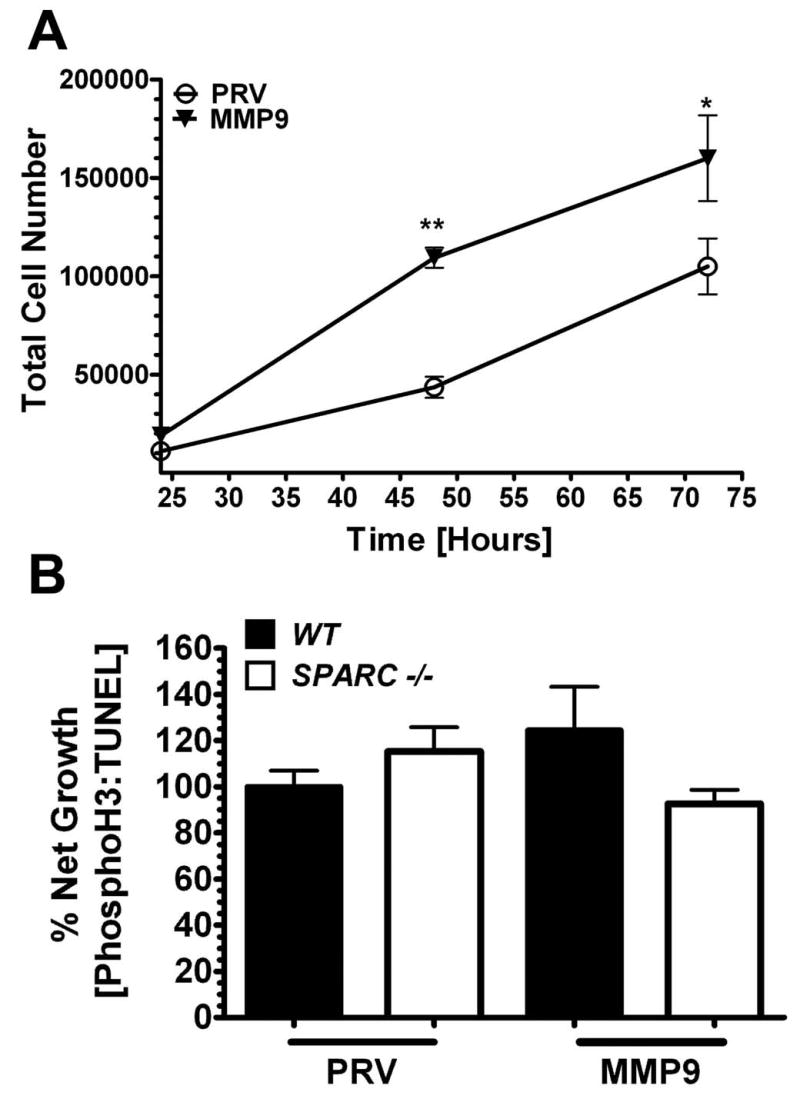
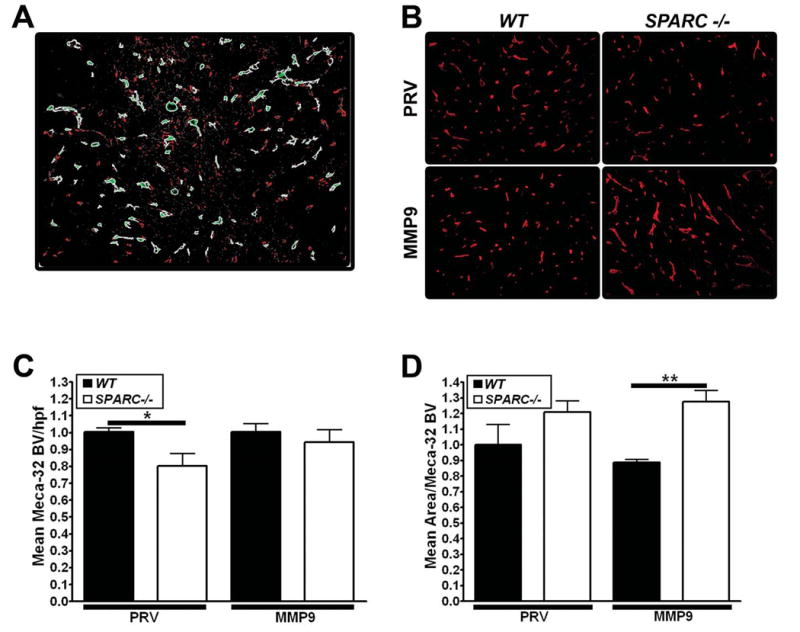
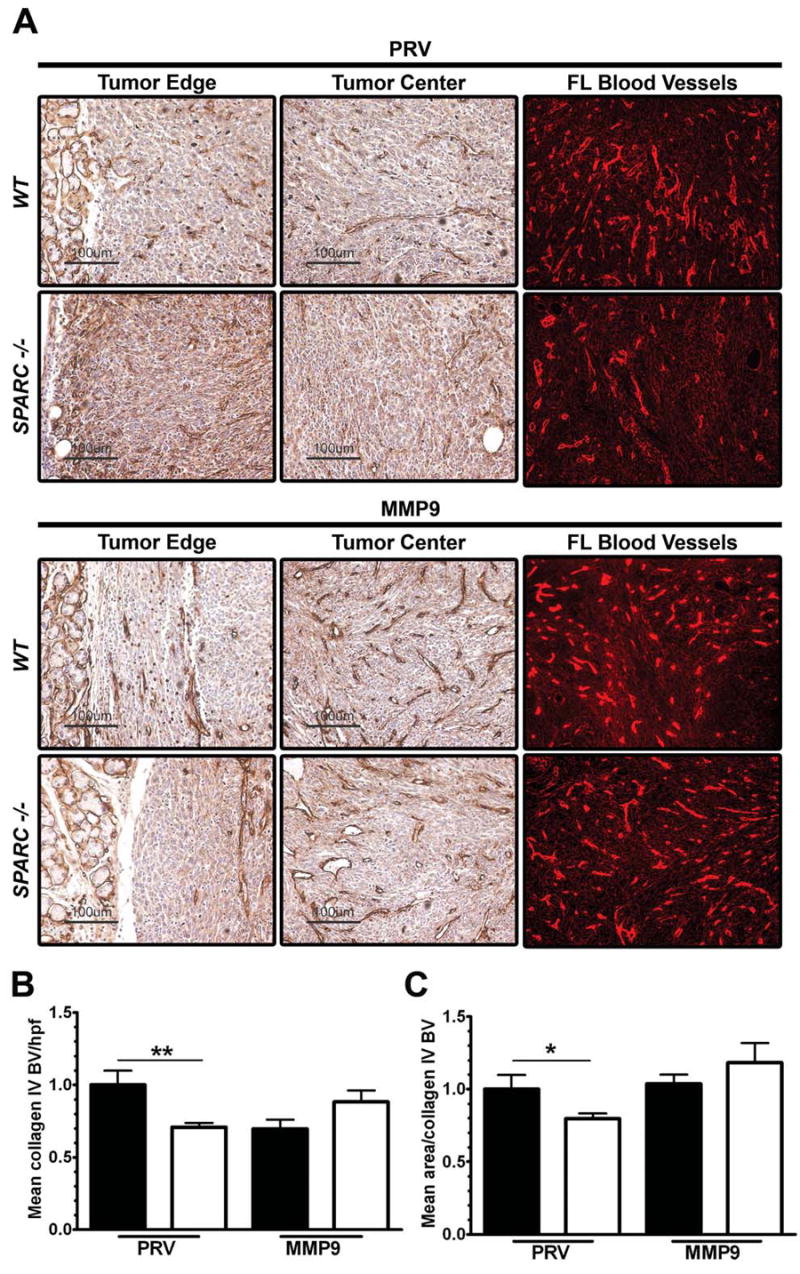
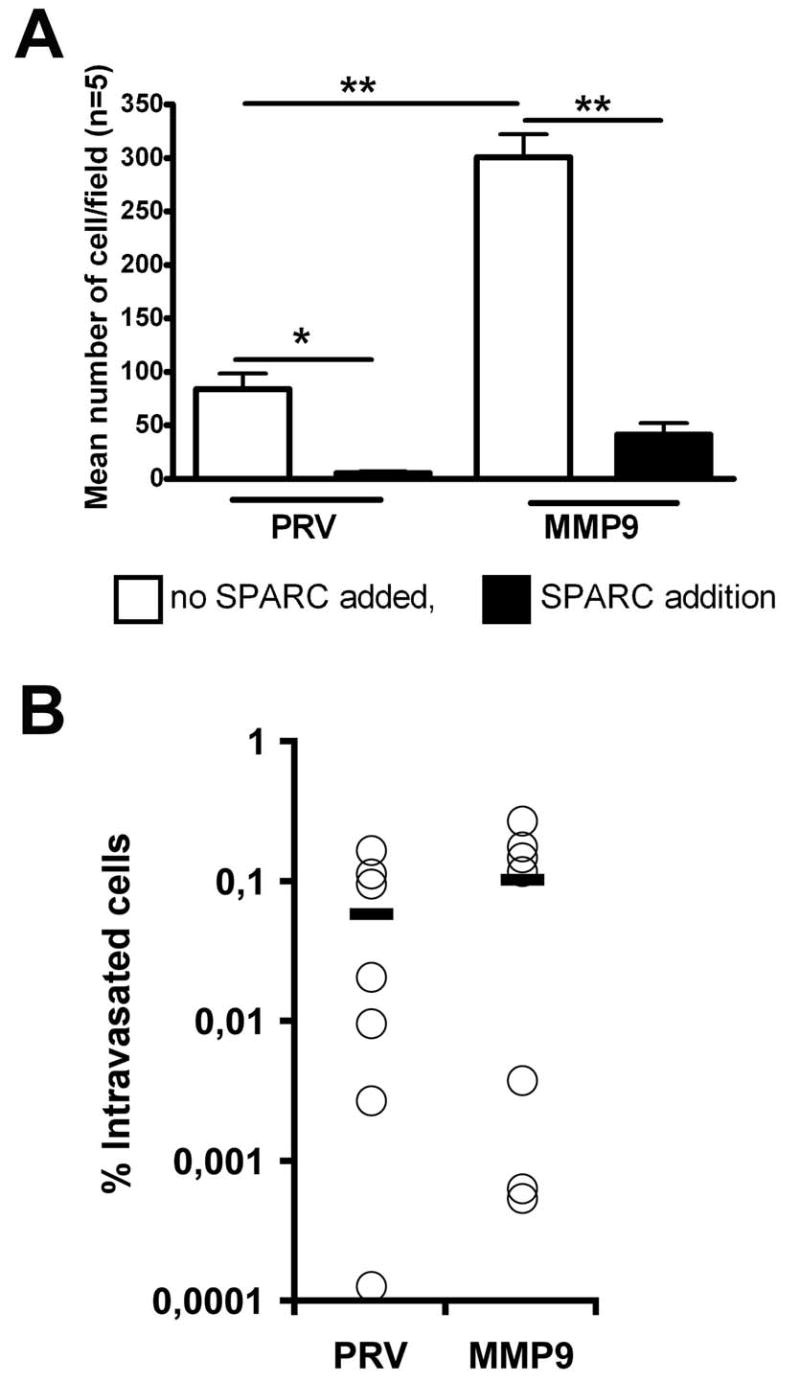
Pancreatic adenocarcinoma is characterized by desmoplasia, local invasion, and metastasis. These features are regulated in part by MMP9 and SPARC. To explore the interaction of SPARC and MMP9 in cancer, we first established orthotopic pancreatic tumors in SPARC-null and wild-type mice with the murine pancreatic adenocarcinoma cell line, PAN02. MMP9 expression was higher in tumors from wild-type compared to SPARC-null mice. Coincident with lower MMP9 expression, tumors grown in SPARC-null mice were significantly larger, had decreased ECM deposition and reduced microvessel density compared to wild-type controls. In addition, metastasis was enhanced in the absence of host SPARC. Therefore, we next analyzed the orthotopic tumor growth of PAN02 cells transduced with MMP9 or a control empty vector. Forced expression of MMP9 by the PAN02 cells resulted in larger tumors in both wild-type and SPARC-null animals compared to empty vector controls and further diminished ECM deposition. Importantly, forced expression of MMP9 within the tumor reversed the decrease in angiogenesis and abrogated the metastatic potential displayed by control tumors grown in SPARC-null mice. Finally, contrary to the in vivo results, MMP9 increased cell migration in vitro, which was blocked by the addition of SPARC. These results suggest that SPARC and MMP9 interact to regulate many stages of tumor progression including ECM deposition, angiogenesis and metastasis.


Figures

Figure 1
Figure 1
Pancreatic tumor growth is increased in the absence of host SPARC. A) 5 ×10⁵ murine pancreatic adenocarcinoma (PAN02) cells were injected orthotopically into wild-type (WT, n=9) and SPARC-/- (SPARC-/-, n=5) mice. The mice were sacrificed 28 days after tumor cell injection and the weight (g) of the entire pancreas including tumor was determined. The mean pancreas weight +/- SEM for WT and SPARC-/- mice are displayed. *, p<0.01. B) Orthotopic and subcutaneous PAN02 tumors from WT and SPARC-/- mice were harvested, fixed in methyl Carnoys or formalin, respectively, sectioned and evaluated for MMP9 expression by immunohistochemistry. MMP9 levels (green) in subcutaneous tumors were developed with FITC-conjugated secondary antibody and sections counterstained with DAPI to identify nuclei (blue). Arrows indicate cells positive for MMP9. MMP9 levels in orthotopic tumors were developed with a peroxidase-conjugated secondary antibody with subsequent reaction with the chromagen DAB. MMP9 positive cells were hand counted in a minimum of 10 fields/group to be 53.0 +/- 14.7 and 33.8 +/- 5.0 in WT and SPARC-/- mice, respectively (p<0.05). Total magnification is 400×.
Figure 2
Figure 2
Neutrophils express MMP9 and their infiltration into PAN02 tumors is reduced in the absence of host SPARC. Paraffin-embedded sections of orthotopic PAN02 tumors grown in WT or SPARC-/- mice were evaluated immunohistochemically for Gr-1 (red) and MMP9 (green) and sections were counterstained with DAPI to identify nuclei. The level of Gr-1 staining and the co-localization of Gr-1 with MMP9 was quantified using Metamorph software. Total magnification is 400×.
Figure 3
Figure 3
Characterization of MMP9 and SPARC expression in PAN02-PRV and PAN02-MMP9 cells. A) Gelatinolytic activity in total cell extracts of PAN02-PRV (PRV) and PAN02-MMP9 (MMP). Three serial dilutions of RIPA extracts corresponding to 5, 1, and 0.2 μg of protein were loaded on an 8% gelatin-containing SDS gels. B) Gelatinolytic activity in conditioned medium from the same cells as in (A) after 24 h of serum depletion. In panel A and B HT1080 conditioned media (+) was loaded as a positive control of gelatinolytic activity and shows MMP9 and MMP2 bands. C) Membrane and cytosolic fractions were obtained from total cell lysates. 25 μg of total extracts (E) and cytosolic (C) fraction and 1/6 of the membrane fraction (M) were analyzed on a 10% SDS gel. Western blot analysis of MMP9 and SPARC was performed; anti-TfR (membrane marker) and anti-tubulin (cytosolic marker) were used as controls for fractionation. D) Confocal microscopy of MMP9 (red) in PAN02 cells, cells transduced with the indicated construct are positive for GFP (green). E) PAN02-PRV (PRV) and PAN02-MMP9 (MMP) cells plated on either collagen I or collagen IV slides were analyzed for SPARC (red) expression by immunocytochemistry. Cells transduced with the indicated construct are positive for GFP (green). F) PAN02-PRV (PRV) and PAN02-MMP9 (MMP) cells were analyzed for gelatinase activity (green) by incubating with DQ-gelatin and subsequent confocal microscopy. To-Pro3 cell tracker (red) was used to localize nuclei. G) Quantification of gelatinase activity in PAN02-PRV (PRV) and PAN02-MMP9 (MMP9). Cells were incubated with DQ-gelatin for the indicated time and the fluorescence increment was represented. Values are normalized to PAN02-PRV cells after 3h of incubation (** p<0.01, Students t test).
Figure 4
Figure 4
Forced expression of MMP9 or the absence of host SPARC increases PAN02 tumor growth. A) PAN02-PRV (PRV) and PAN02-MMP9 (MMP9) cells (5 × 10⁵) were implanted orthotopically in the pancreas of age- and sex-matched SPARC-/- and WT mice (n= 6/group). After 6 weeks, the entire pancreas including tumor was weighed (g). A comparison of mean +/- SD pancreas weight is shown (* p<0.05, Student's t test). One way ANOVA with Tukey's multiple comparison test revealed significant differences across tumor groups as well. PAN02-PRV tumors in WT mice were significantly smaller than PAN02-MMP9 tumors grown in WT mice (p<0.01) or SPARC-/- mice (p<0.001) while PAN02-PRV tumors in SPARC-/- mice were significantly different from PAN02-MMP9 in SPARC-/- mice (p<0.001). B) Masson's trichrome staining of paraffin-embedded tumors revealed decreased collagen fibers (blue) in tumors grown in SPARC-/- mice compared with those in WT mice. Forced expression of MMP9 resulted in an even further reduction in collagen deposition in response to tumor growth. C) Tumor extracts from PAN02-PRV (PRV) and PAN02-MMP9 (MMP9) grown in WT and SPARC -/- mice were analyzed by gelatin zymography. The bands corresponding to MMP9 are indicated. Western blot analysis of tubulin in equivalent amount of extracts was performed as a loading control.
Figure 5
Figure 5
PAN02 proliferation and apoptosis in vitro and in vivo. A) In vitro proliferation of PAN02-PRV (PRV) and PAN02-MMP9 (MMP9) cells at 24, 48 and 72 hrs after seeding in DMEM containing 5% FBS. (*, p<0.05; **, p<0.01; two-way ANOVA with Bonferroni post-test) B) Net growth of tumors from PAN02-PRV (PRV) and PAN02-MMP9 (MMP9) cells grown in WT and SPARC -/- mice. Proliferating and apoptotic cells in tumor sections were counted by detecting nuclei positive for phosphorylated histone H3 (PhosphoH3) or terminal deoxynucleotidyl transferase mediated dUTP nick-end-labeling (TUNEL), respectively. The ratio of PhosphoH3 to TUNEL positive cells (% Net Growth) was calculated and normalized to PAN02-PRV (PRV) cells from WT mice. There was no significant difference between any groups (one-way ANOVA with Tukey's multiple comparison test)
Figure 6
Figure 6
Analysis of angiogenesis in PAN02 tumors grown in SPARC-/- and WT mice. The number and size of blood vessels in tumors from PAN02-PRV (PRV) and PAN02-MMP9 (MMP9) cells were analyzed by immunohistochemistry of paraffin-embedded sections of tumors grown in WT or SPARC-/- mice. A) An example of integrated morphometric analysis (IMA) of immunofluorescence reactivity using MetaMorph software on Meca32 staining. An intensity and size threshold was set and maintained for every tumor section analyzed. Examples of objects meeting the size and intensity restrictions of blood vessels are shown in light green staining. B) MECA-32 immunofluorescence C) Mean blood vessel number/hpf and D) mean area/blood vessel were determined by IMA. C, D) Vascular parameters were normalized to PAN02-PRV tumors grown in WT mice to ease comparison between groups (*, p<0.05; **, p<0.01; one-way ANOVA with Tukey's multiple comparison test).
Figure 7
Figure 7
Collagen IV deposition in vascular basement membranes is altered by tumor cell expression of MMP9. A) The level and localization of collagen IV was determined immunohistochemically in PAN02-PRV (PRV) and PAN02-MMP9 (MMP9) tumors grown in WT and SPARC-/- mice. Collagen IV Immunofluorescent staining was evaluated by integrated morphometric analysis (IMA) for B) Mean blood vessel number/hpf and C) mean area/blood vessel. Total magnification of the fluorescent images is 200×. Vascular parameters were normalized to PAN02-PRV tumors grown in WT mice to ease comparison between groups (*, p<0.05; **, p<0.01; one-way ANOVA with Tukey's multiple comparison test).
Figure 8
Figure 8
MMP9 expression confers increased PAN02 cell migration in vitro but not in vivo. A) PAN02-PRV (PRV) and PAN02-MMP9 (MMP9) cells in serum-free media were added to the top of an uncoated transwell insert. Serum-free media was added to the chamber below the insert. After 18 hours the inserts were removed, fixed, stained with hematoxylin, and the number of cells that migrated across the insert were counted. The mean +/- SEM number of cells/field (n=5/condition) is displayed. Addition of rSPARC (10 μg/ml) to the wells significantly decreased the number of cells that migrated (*, p<0.05; **, p<0.01). B) Cell invasion was evaluated by quantitative PCR of mouse DNA purified from CAM inoculated with PAN02 cells. Data represent the percentage of intravasated mouse cells in each sample. Mean value for PAN02-PRV and PAN02-MMP9 cells were 0.059 and 0.104 respectively. No significant differences in mean values were found (Mann-Whitney test).

References

    1. Brekken RA, Sage EH. SPARC, a matricellular protein: at the crossroads of cell-matrix communication. Matrix Biol. 2001;19:816–827. - PubMed
    1. Bornstein P. Cell-matrix interactions: the view from the outside. Methods Cell Biol. 2002;69:7–11. - PubMed
    1. Lane TF, Sage EH. The biology of SPARC, a protein that modulates cell-matrix interactions. Faseb J. 1994;8:163–173. - PubMed
    1. Liaw L, Crawford HC. Functions of the extracellular matrix and matrix degrading proteases during tumor progression. Braz J Med Biol Res. 1999;32:805–812. - PubMed
    1. Motamed K, Sage EH. Regulation of vascular morphogenesis by the matricellular protein SPARC. Kidney Int. 1997;51:1383–1387. - PubMed

Publication types

MeSH terms