

Implication of leucyl-tRNA synthetase 1 (LARS1) over-expression in growth and migration of lung cancer cells detected by siRNA targeted knock-down analysis
- PMID: 18446061
- PMCID: PMC2679304
- DOI: 10.3858/emm.2008.40.2.229
Implication of leucyl-tRNA synthetase 1 (LARS1) over-expression in growth and migration of lung cancer cells detected by siRNA targeted knock-down analysis
Abstract
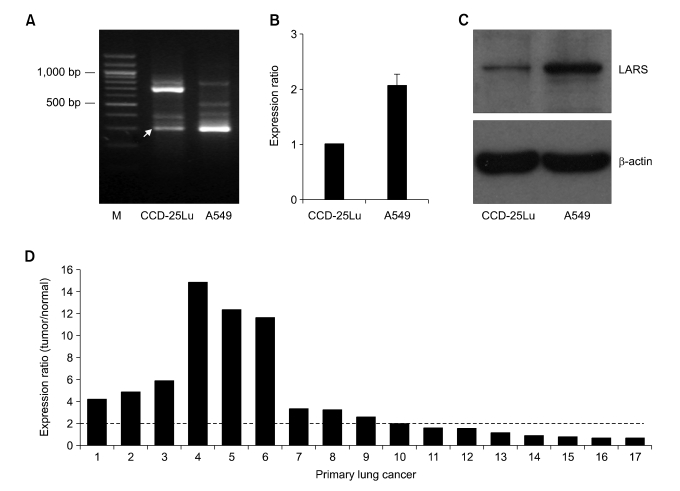
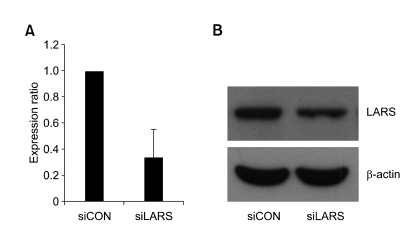
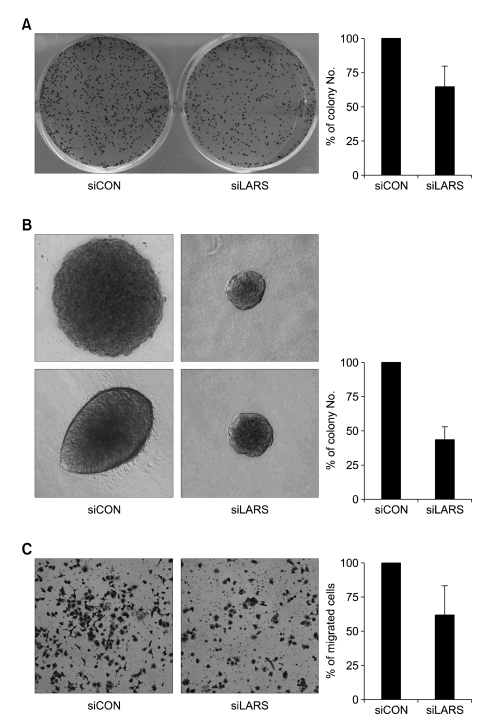
Molecular mechanism of lung carcinogenesis and its aggressive nature is still largely elusive. To uncover the biomarkers related with tumorigenesis and behavior of lung cancer, we screened novel differentially expressed genes (DEG) in A549 lung cancer cell line by comparison with CCD-25Lu, normal pulmonary epithelial cell line, using annealing control primer(ACP)-based GeneFishing system. Of the DEGs, over-expression of leucyl-tRNA synthetase 1 (LARS1) was prominent and this up-regulation was confirmed by immunoblotting and real-time quantitative RT-PCR analysis. In addition to A549 cell line, primary lung cancer tissues also expressed higher level of LARS1 mRNA than their normal counter tissues. To explore the oncogenic potential of LARS1 over-expression in lung cancer, we knocked-down LARS1 by treating siRNA and observed the tumor behavior. LARS1 knock-down cells showed reduced ability to migrate through transwell membrane and to form colonies in both soft agar and culture plate. Taken together, these findings suggest that LARS1 may play roles in migration and growth of lung cancer cells, which suggest its potential implication in lung tumorigenesis.
Figures
Similar articles
-
PGC-1α Regulates Cell Proliferation, Migration, and Invasion by Modulating Leucyl-tRNA Synthetase 1 Expression in Human Colorectal Cancer Cells.Cancers (Basel). 2022 Dec 27;15(1):159. doi: 10.3390/cancers15010159. Cancers (Basel). 2022. PMID: 36612155 Free PMC article.
-
Leucine-sensing mechanism of leucyl-tRNA synthetase 1 for mTORC1 activation.Cell Rep. 2021 Apr 27;35(4):109031. doi: 10.1016/j.celrep.2021.109031. Cell Rep. 2021. PMID: 33910001
-
Leucyl-tRNA synthetase 1 is required for proliferation of TSC-null cells.Biochem Biophys Res Commun. 2021 Sep 24;571:159-166. doi: 10.1016/j.bbrc.2021.07.080. Epub 2021 Jul 27. Biochem Biophys Res Commun. 2021. PMID: 34325132
-
Deep phenotyping of MARS1 (interstitial lung and liver disease) and LARS1 (infantile liver failure syndrome 1) recessive multisystemic disease using Human Phenotype Ontology annotation: Overlap and differences. Case report and review of literature.Eur J Med Genet. 2021 Nov;64(11):104334. doi: 10.1016/j.ejmg.2021.104334. Epub 2021 Sep 5. Eur J Med Genet. 2021. PMID: 34496286 Review.
-
Aminoacyl-tRNA synthetases and amino acid signaling.Biochim Biophys Acta Mol Cell Res. 2021 Jan;1868(1):118889. doi: 10.1016/j.bbamcr.2020.118889. Epub 2020 Oct 20. Biochim Biophys Acta Mol Cell Res. 2021. PMID: 33091505 Review.
Cited by
-
Aminoacyl-tRNA synthetases in medicine and disease.EMBO Mol Med. 2013 Mar;5(3):332-43. doi: 10.1002/emmm.201100626. Epub 2013 Feb 21. EMBO Mol Med. 2013. PMID: 23427196 Free PMC article. Review.
-
Aminoacyl-tRNA synthetases.RNA. 2020 Aug;26(8):910-936. doi: 10.1261/rna.071720.119. Epub 2020 Apr 17. RNA. 2020. PMID: 32303649 Free PMC article. Review.
-
Identification of glutamyl-prolyl-tRNA synthetase as a new therapeutic target in hepatocellular carcinoma via a novel bioinformatic approach.J Gastrointest Oncol. 2023 Apr 29;14(2):636-649. doi: 10.21037/jgo-23-247. Epub 2023 Apr 27. J Gastrointest Oncol. 2023. PMID: 37201074 Free PMC article.
-
Proteomic analysis enables distinction of early- versus advanced-stage lung adenocarcinomas.Clin Transl Med. 2020 Jun;10(2):e106. doi: 10.1002/ctm2.106. Epub 2020 Jun 14. Clin Transl Med. 2020. PMID: 32536039 Free PMC article.
-
Codon optimality, bias and usage in translation and mRNA decay.Nat Rev Mol Cell Biol. 2018 Jan;19(1):20-30. doi: 10.1038/nrm.2017.91. Epub 2017 Oct 11. Nat Rev Mol Cell Biol. 2018. PMID: 29018283 Free PMC article. Review.
References
-
- Balsara BR, Testa JR. Chromosomal imbalances in human lung cancer. Oncogene. 2002;21:6877–6883. - PubMed
-
- Boyle P, Ferlay J. Cancer incidence and mortality in Europe. Ann Oncol. 2005;16:481–488. - PubMed
-
- Crnković-Mertens I, Muley T, Meister M, Hartenstein B, Semzow J, Butz K, Hoppe-Seyler F. The anti-apoptotic livin gene is an important determinant for the apoptotic resistance of non-small cell lung cancer cells. Lung Cancer. 2006;54:135–142. - PubMed
-
- Ferrigino D, Bucheri G, Giordano C. Neuron-specific enolase is an effective tumor marker in nonsmall cell lung cancer (NSCLC) Lung Cancer. 2003;41:311–320. - PubMed
-
- Greenberg AK, Lee MS. Biomarkers for lung cancer: clinical uses. Curr Opin Pulm Med. 2007;13:249–255. - PubMed
Publication types
MeSH terms
Substances
LinkOut - more resources
Full Text Sources
Other Literature Sources
Medical