. 2008 Apr 30;3(4):e2045.
doi: 10.1371/journal.pone.0002045.

Calmodulin activation by calcium transients in the postsynaptic density of dendritic spines

Affiliations

Calmodulin activation by calcium transients in the postsynaptic density of dendritic spines

Daniel X Keller et al. PLoS One. .

Abstract

The entry of calcium into dendritic spines can trigger a sequence of biochemical reactions that begins with the activation of calmodulin (CaM) and ends with long-term changes to synaptic strengths. The degree of activation of CaM can depend on highly local elevations in the concentration of calcium and the duration of transient increases in calcium concentration. Accurate measurement of these local changes in calcium is difficult because the spaces are so small and the numbers of molecules are so low. We have therefore developed a Monte Carlo model of intracellular calcium dynamics within the spine that included calcium binding proteins, calcium transporters and ion channels activated by voltage and glutamate binding. The model reproduced optical recordings using calcium indicator dyes and showed that without the dye the free intracellular calcium concentration transient was much higher than predicted from the fluorescent signal. Excitatory postsynaptic potentials induced large, long-lasting calcium gradients across the postsynaptic density, which activated CaM. When glutamate was released at the synapse 10 ms before an action potential occurred, simulating activity patterns that strengthen hippocampal synapses, the calcium gradient and activation of CaM in the postsynaptic density were much greater than when the order was reversed, a condition that decreases synaptic strengths, suggesting a possible mechanism underlying the induction of long-term changes in synaptic strength. The spatial and temporal mechanisms for selectivity in CaM activation demonstrated here could be used in other signaling pathways.


Conflict of interest statement

Competing Interests: The authors have declared that no competing interests exist.

Figures

Figure 1
Figure 1. Schematic representation of the model.
(A) A segment of dendrite with a single spine (grey). A presynaptic bouton (green) was separated from the synaptic face of the spine by a 20 nm cleft. (B) voltage-dependent calcium channels (yellow) were randomly distributed at low densities across the spine and dendrite membranes, whereas NMDARs (red) and AMPARs (not shown) were restricted to a patch centered on the synaptic face of the spine. (C) Calcium pumps were distributed evenly on the cell membrane. (D) CBPs were uniformly distributed in the interior.
Figure 2
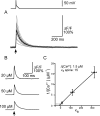
Figure 2. Calcium currents through voltage-dependent calcium channels.
Relevant voltage traces at the synapse are shown above each column. (A) Ensemble average (n = 40) of open voltage-dependent calcium channels across 1 µm2 of membrane in response to a backpropagating action potential elicited by a current injection into the soma (at arrow). Inset: Single trials show voltage-dependent calcium channel stochasticity. (B) Average voltage-dependent rate of calcium ion flux through a single open voltage-dependent calcium channel during action potential, as derived from the NEURON simulation. (C) Current density (solid trace) and cumulative flux of calcium ions across 1 µm2 during an action potential (dashed trace). (D) Ensemble average (n = 100) of open NMDARs across 1 µm2 of membrane in response to the release of glutamate (at arrow) and a small depolarization. Inset: Probability distribution of n for a 4.5 pS NMDAR at −65 mV. (E) Average rate of calcium ion flux through a single NMDAR as a function of voltage during an excitatory postsynaptic potential (F) Calcium current density from 10 NMDA receptors distributed across the postsynaptic density (solid trace).
Figure 3
Figure 3. Calcium dynamics following an action potential.
(A) Volume-averaged OGB1 (100 µM) fluorescent transients. Grey traces, single trials; black trace, ensemble average of 20 trials. The inset shows the dendritic voltage during the event. (B) Action potential-evoked transients simulated with different concentrations of OGB1. (C) Inverse amplitude of [Ca2+]pred as a function of κB. Each point shows the mean±SD for 20 trials with different concentrations of indicator. A regression line (solid line) was fit to the data. Extrapolating the line, the y-intercept gave the estimated amplitude of the unperturbed transient, the x-intercept gives the estimated κS.
Figure 4
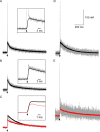
Figure 4. Action potential-induced transients visualized with an indicator.
(A) True calcium concentration (grey trace) in action potential simulations run with 100 µM of OGB1. [Ca2+]pred (black trace) is derived from the fluorescent transient. The calcium concentration predicted by the dye did not rigorously follow the time course of the actual calcium transient. The inset shows an expanded view of the initial rise segment. (B) Increasing both the on-rate and the off-rate by a factor of 10, thereby maintaining the same Kd, diminishes the discrepancy between the calcium signal (grey) and the indicator-predicted signal (black). The inset shows an expanded view of the initial rise segment. (C) Immobile indicator caused the indictor calcium signal to linger (black trace) as compared with the signal obtained using indicator that diffused at the normal diffusion-rate (grey trace). Increasing the diffusion constant of the indicator by a factor of 10 (red trace) increased the decay rate from the spine head as well as equilibration with the dendritic shaft. Eventually the calcium signal in all traces converges to the slower dendritic removal rate. The inset shows the first few milliseconds of the event. (D) The predicted calcium (black trace) and actual calcium using an immobile indicator. (E) The predicted calcium (red trace) and actual calcium using a 10x mobile indicator.
Figure 5
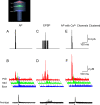
Figure 5. Input-dependent calcium gradients across the spine, in the presence of 45 µM calbindin-D28k.
(A) Instantaneous calcium current through voltage-dependent calcium channels in the spine during an action potential. The time of somatic current injections is indicated by the arrow. (B) Schematic (lower left) shows the spine subdivided into three distinct sampling regions: the postsynaptic density (red), the middle (green), and the base (blue) of the spine calcium concentration in each of the three sampling regions is shown during the action potential. The colors of traces correspond to the three sampling regions shown in the schematic. Action potentials did not result in calcium gradients across the spine. The black trace at the bottom of the figure shows the volume-averaged [Ca2+]i in the entire spine. (C) Instantaneous calcium current through NMDARs during an excitatory postsynaptic potential. (D) Calcium concentration in each of the three subregions of the spine during an excitatory postsynaptic potential as well as the volume average. Excitatory postsynaptic potentials resulted in large calcium gradients across the spine. (E) Open voltage-dependent calcium channel channels during an action potential simulation in which voltage-dependent calcium channels were clustered at the postsynaptic density. (F) Input-dependent calcium gradients across the spine during the action potential. Calcium concentration is shown in each of the three sampling regions, and the volume average is depicted at the bottom.
Figure 6
Figure 6. The effect of shifting the order of excitatory postsynaptic potential and action potential stimuli on calcium gradients across the spine, in the presence of 45 µM calbindin-D28k.
An excitatory postsynaptic potential (EPSP) preceding an action potential (AP) by 10 ms results in increased calcium influx. (A) Instantaneous calcium current through NMDARs. (B) Calcium concentration in each of the three subregions of the spine during the EPSP-AP event. Note the large calcium gradient across the spine. The black trace shows the volume averaged [Ca2+]i in the entire spine when an excitatory postsynaptic potential preceded an action potential by 10 ms. The arrow indicates the time of glutamate release. (C) Open NMDARs when the stimulus is an action potential preceding an excitatory postsynaptic potential by 10 ms. (D) Input-dependent calcium gradients across the spine. The black trace shows the volume averaged [Ca2+]i in the entire spine.
Figure 7
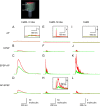
Figure 7. Activation of CaM is sensitive to its distribution and the mode of calcium entry.
The schematic shows the two populations of CaM, concentrated in the postsynaptic density and also uniformly distributed through the spine. (A) Action potential (AP)-evoked changes in CaM-2 C-lobe activation with CaM either clustered at the postsynaptic density (red) or uniformly distributed throughout the spine (green). The inset zoom shows no significant difference between clustered and uniform C-lobe responses. (B) Excitatory postsynaptic potential (EPSP)-evoked CaM-2 C-lobe transients. (C) EPSP-AP-evoked CaM-2 C-lobe transients. (D) AP-EPSP-evoked CaM-2 C-lobe transients (E) AP-evoked changes in CaM-2 N-lobe activation. The inset shows a close-up view. The N-lobe of diffuse calmodulin is slightly more activated than that of calmodulin clustered at the postsynaptic density. (F) EPSP-evoked CaM-2 N-lobe transients. (G) EPSP-AP-evoked CaM-2 N lobe transients. (H) AP-EPSP-evoked CaM-2 N lobe transients. The inset shows a close-up view. The N-lobe of diffuse calmodulin was slightly more activated than that of calmodulin clustered at the postsynaptic density in response to the action potential component, but in response to the excitatory postsynaptic potential component the N-lobe clustered calmodulin exhibited a greater response. (I) Action potential induced changes in CaM-4 activation. (J) EPSP-evoked CaM-4 activation. (K) EPSP-AP-evoked CaM-4 activation. (L) AP-EPSP-evoked CaM-4 activation. Each trace is the average of 20 trials.

References

    1. Kennedy MB. Regulation of neuronal function by calcium. Trends Neurosci. 1989;12:417–420. - PubMed
    1. Koch C, Zador A. The function of dendritic spines: devices subserving biochemical rather than electrical compartmentalization. J Neurosci. 1993;3(2):413–22. - PMC - PubMed
    1. Sabatini B, Oertner TG, Svoboda K. The life cycle of Ca2+ ions in dendritic spines. Neuron. 2002;33:439–452. - PubMed
    1. Svoboda K, Tank DW, Denk W. Direct measurement of coupling between dendritic spines and shafts. Science. 1996;272(5262):716–719. - PubMed
    1. Majewska A, Brown E, Ross J, Yuste R. Mechanisms of calcium decay kinetics in hippocampal spines: role of spine calcium pumps and calcium diffusion through the spine neck in biochemical compartmentalization. J Neurosci. 2000;20(5):1722–1734. - PMC - PubMed

Publication types