Calcium triggered L alpha-H2 phase transition monitored by combined rapid mixing and time-resolved synchrotron SAXS
- PMID: 18446202
- PMCID: PMC2320977
- DOI: 10.1371/journal.pone.0002072
Calcium triggered L alpha-H2 phase transition monitored by combined rapid mixing and time-resolved synchrotron SAXS
Abstract
Background: Awad et al. reported on the Ca(2+)-induced transitions of dioleoyl-phosphatidylglycerol (DOPG)/monoolein (MO) vesicles to bicontinuous cubic phases at equilibrium conditions. In the present study, the combination of rapid mixing and time-resolved synchrotron small-angle X-ray scattering (SAXS) was applied for the in-situ investigations of fast structural transitions of diluted DOPG/MO vesicles into well-ordered nanostructures by the addition of low concentrated Ca(2+) solutions.
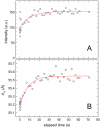
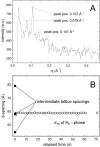
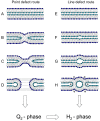
Methodology/principal findings: Under static conditions and the in absence of the divalent cations, the DOPG/MO system forms large vesicles composed of weakly correlated bilayers with a d-spacing of approximately 140 A (L(alpha)-phase). The utilization of a stopped-flow apparatus allowed mixing these DOPG/MO vesicles with a solution of Ca(2+) ions within 10 milliseconds (ms). In such a way the dynamics of negatively charged PG to divalent cation interactions, and the kinetics of the induced structural transitions were studied. Ca(2+) ions have a very strong impact on the lipidic nanostructures. Intriguingly, already at low salt concentrations (DOPG/Ca(2+)>2), Ca(2+) ions trigger the transformation from bilayers to monolayer nanotubes (inverted hexagonal phase, H(2)). Our results reveal that a binding ratio of 1 Ca(2+) per 8 DOPG is sufficient for the formation of the H(2) phase. At 50 degrees C a direct transition from the vesicles to the H(2) phase was observed, whereas at ambient temperature (20 degrees C) a short lived intermediate phase (possibly the cubic Pn3m phase) coexisting with the H(2) phase was detected.
Conclusions/significance: The strong binding of the divalent cations to the negatively charged DOPG molecules enhances the negative spontaneous curvature of the monolayers and causes a rapid collapsing of the vesicles. The rapid loss of the bilayer stability and the reorganization of the lipid molecules within ms support the argument that the transition mechanism is based on a leaky fusion of the vesicles.
Conflict of interest statement
Figures


Similar articles
-
The role of calcium in membrane condensation and spontaneous curvature variations in model lipidic systems.Phys Chem Chem Phys. 2011 Feb 28;13(8):3115-25. doi: 10.1039/c0cp01036g. Epub 2010 Nov 3. Phys Chem Chem Phys. 2011. PMID: 21049109
-
Kinetics of lamellar-to-cubic and intercubic phase transitions of pure and cytochrome c containing monoolein dispersions monitored by time-resolved small-angle X-ray diffraction.Langmuir. 2005 Apr 12;21(8):3559-71. doi: 10.1021/la046873e. Langmuir. 2005. PMID: 15807602
-
Calcium mediated DNA binding in non-lamellar structures formed by DOPG/glycerol monooleate.Chem Phys Lipids. 2021 Sep;239:105118. doi: 10.1016/j.chemphyslip.2021.105118. Epub 2021 Jul 16. Chem Phys Lipids. 2021. PMID: 34280362
-
Structural characterization of lipidic systems under nonequilibrium conditions.Eur Biophys J. 2012 Oct;41(10):831-40. doi: 10.1007/s00249-012-0815-7. Epub 2012 May 9. Eur Biophys J. 2012. PMID: 22569535 Review.
-
Cubic phases in membrane lipids.Eur Biophys J. 2012 Oct;41(10):841-50. doi: 10.1007/s00249-012-0819-3. Epub 2012 May 15. Eur Biophys J. 2012. PMID: 22584384 Review.
Cited by
-
Self-assembly in monoelaidin aqueous dispersions: direct vesicles to cubosomes transition.PLoS One. 2008;3(11):e3747. doi: 10.1371/journal.pone.0003747. Epub 2008 Nov 18. PLoS One. 2008. PMID: 19015726 Free PMC article.
-
Unfolding bovine α-lactalbumin with T-jump: Characterizing disordered intermediates via time-resolved x-ray solution scattering and molecular dynamics simulations.J Chem Phys. 2021 Mar 14;154(10):105101. doi: 10.1063/5.0039194. J Chem Phys. 2021. PMID: 33722011 Free PMC article.
-
Recent advances in drug delivery applications of cubosomes, hexosomes, and solid lipid nanoparticles.Acta Pharm Sin B. 2021 Apr;11(4):871-885. doi: 10.1016/j.apsb.2021.02.013. Epub 2021 Feb 24. Acta Pharm Sin B. 2021. PMID: 33996404 Free PMC article. Review.
-
In Situ Monitoring of Nanostructure Formation during the Digestion of Mayonnaise.ACS Omega. 2017 Apr 30;2(4):1441-1446. doi: 10.1021/acsomega.7b00153. Epub 2017 Apr 12. ACS Omega. 2017. PMID: 30023634 Free PMC article.
-
Millisecond Phase Transition Kinetics of Lyotropic Liquid Crystalline Nanoparticles Observed by Time-Resolved Small Angle X-ray Solution Scattering.Chemphyschem. 2025 Jul 18;26(14):e202401072. doi: 10.1002/cphc.202401072. Epub 2025 May 25. Chemphyschem. 2025. PMID: 40293325 Free PMC article.
References
-
- Awad TS, Okamoto Y, Masum SMD, Yamazaki M. Formation of cubic phases from large unilamellar vesicles of dioleoylphosphatidylglycerol/monoolein membranes induced by low concentrations of Ca2+. Langmuir. 2005;21:11556–11561. - PubMed
-
- Goodsell DS. In: Bionanotechnology Lessons from Nature. Rosen MR, editor. New Jersey, USA: Wiley-Liss Publishers; 2004. pp. 227–294. (2004) In:
-
- Zhang J, Wang ZL, Liu J, Chen S, Liu GY. In: Self-assembled nanostructures. Series title: Nanostructure Science and Technology. Lockwood DJ, editor. New York, USA: Kluwer Academic/Plenum Publishers; 2002.
-
- Couvreur P, Vauthier C. Nanotechnology: intelligent design to treat complex disease. Pharm Res. 2006;23:1417–1450. - PubMed
-
- Boyd BJ. Colloidal drug delivery. Drug Deliv Rep. 2005;Autumn/Winter:63–69.
Publication types
MeSH terms
Substances
LinkOut - more resources
Full Text Sources
Miscellaneous

