

Counting the founders: the matrilineal genetic ancestry of the Jewish Diaspora
- PMID: 18446216
- PMCID: PMC2323359
- DOI: 10.1371/journal.pone.0002062
Counting the founders: the matrilineal genetic ancestry of the Jewish Diaspora
Abstract
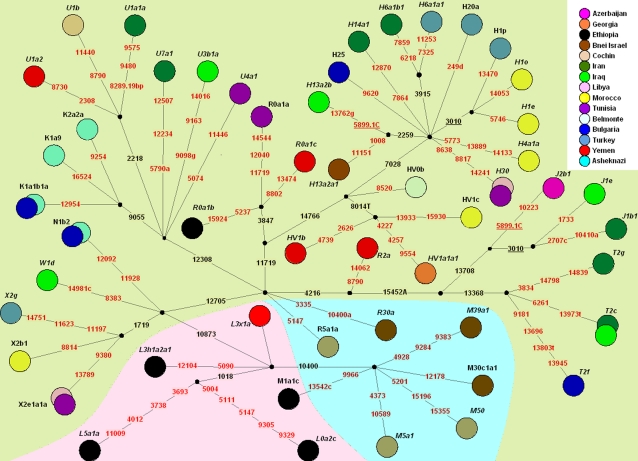
The history of the Jewish Diaspora dates back to the Assyrian and Babylonian conquests in the Levant, followed by complex demographic and migratory trajectories over the ensuing millennia which pose a serious challenge to unraveling population genetic patterns. Here we ask whether phylogenetic analysis, based on highly resolved mitochondrial DNA (mtDNA) phylogenies can discern among maternal ancestries of the Diaspora. Accordingly, 1,142 samples from 14 different non-Ashkenazi Jewish communities were analyzed. A list of complete mtDNA sequences was established for all variants present at high frequency in the communities studied, along with high-resolution genotyping of all samples. Unlike the previously reported pattern observed among Ashkenazi Jews, the numerically major portion of the non-Ashkenazi Jews, currently estimated at 5 million people and comprised of the Moroccan, Iraqi, Iranian and Iberian Exile Jewish communities showed no evidence for a narrow founder effect, which did however characterize the smaller and more remote Belmonte, Indian and the two Caucasus communities. The Indian and Ethiopian Jewish sample sets suggested local female introgression, while mtDNAs in all other communities studied belong to a well-characterized West Eurasian pool of maternal lineages. Absence of sub-Saharan African mtDNA lineages among the North African Jewish communities suggests negligible or low level of admixture with females of the host populations among whom the African haplogroup (Hg) L0-L3 sub-clades variants are common. In contrast, the North African and Iberian Exile Jewish communities show influence of putative Iberian admixture as documented by mtDNA Hg HV0 variants. These findings highlight striking differences in the demographic history of the widespread Jewish Diaspora.
Conflict of interest statement
Figures

References
-
- DellaPergola S. Jewish Demography 2001. In: DellaPergola S, Even S, editors. Papers in Jewish Demography. Jerusalem: The Hebrew University of Jerusalem Press; 2001. pp. 11–33.
-
- Behar DM, Garrigan D, Kaplan ME, Mobasher Z, Rosengarten D, et al. Contrasting patterns of Y chromosome variation in Ashkenazi Jewish and host non-Jewish European populations. Hum Genet. 2004;114:354–365. - PubMed
-
- Behar DM, Hammer MF, Garrigan D, Villems R, Bonne-Tamir B, et al. MtDNA evidence for a genetic bottleneck in the early history of the Ashkenazi Jewish population. Eur J Hum Genet. 2004;12:355–364. - PubMed
Publication types
MeSH terms
Substances
LinkOut - more resources
Full Text Sources
