. 2008 Apr 30;3(4):e2068.
doi: 10.1371/journal.pone.0002068.

The impact of the absence of aliphatic glucosinolates on insect herbivory in Arabidopsis

Affiliations

The impact of the absence of aliphatic glucosinolates on insect herbivory in Arabidopsis

Jules Beekwilder et al. PLoS One. .

Abstract

Aliphatic glucosinolates are compounds which occur in high concentrations in Arabidopsis thaliana and other Brassicaceae species. They are important for the resistance of the plant to pest insects. Previously, the biosynthesis of these compounds was shown to be regulated by transcription factors MYB28 and MYB29. We now show that MYB28 and MYB29 are partially redundant, but in the absence of both, the synthesis of all aliphatic glucosinolates is blocked. Untargeted and targeted biochemical analyses of leaf metabolites showed that differences between single and double knock-out mutants and wild type plants were restricted to glucosinolates. Biosynthesis of long-chain aliphatic glucosinolates was blocked by the myb28 mutation, while short-chain aliphatic glucosinolates were reduced by about 50% in both the myb28 and the myb29 single mutants. Most remarkably, all aliphatic glucosinolates were completely absent in the double mutant. Expression of glucosinolate biosynthetic genes was slightly but significantly reduced by the single myb mutations, while the double mutation resulted in a drastic decrease in expression of these genes. Since the myb28myb29 double mutant is the first Arabidopsis genotype without any aliphatic glucosinolates, we used it to establish the relevance of aliphatic glucosinolate biosynthesis to herbivory by larvae of the lepidopteran insect Mamestra brassicae. Plant damage correlated inversely to the levels of aliphatic glucosinolates observed in those plants: Larval weight gain was 2.6 fold higher on the double myb28myb29 mutant completely lacking aliphatic glucosinolates and 1.8 higher on the single mutants with intermediate levels of aliphatic glucosinolates compared to wild type plants.


Conflict of interest statement

Competing Interests: The authors have declared that no competing interests exist.

Figures

Figure 1
Figure 1. Chemical structures of the major glucosinolates in Arabidopsis thaliana Col-0.
Figure 2
Figure 2. Position of the insertions in knock-out mutants of MYB28 (top) and MYB29 (bottom).
Black areas represent translated regions, white areas represent untranslated regions and introns. Numbers indicate the position from the startcodon.
Figure 3
Figure 3. Score plot from principal component analysis of LC-MS metabolic profiles of wild type and mutant Arabidopsis lines.
Contributions of principal components to separation of the samples are indicated on the axes.
Figure 4
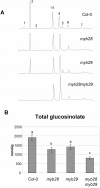
Figure 4. Glucosinolate contents of Arabidopsis lines.
(A) HPLC profiles of glucosinolate extracts recorded at 229 nm. Numbers indicate glucosinolates: 1: glucoiberin (C3); 2: glucoraphanin (C4); 3: glucoalyssin (C5); 6: glucobrassicin (indole); 5: glucohirsutin (C8); 6: 4-methoxyglucobrassicin (indole); 7: neoglucobrassicin (indole); i.s.: internal standard (glucotropaeolin). (B) Total glucosinolate concentration in leaves of wild type (Col-0) and mutant plants (myb28, myb29, myb28myb29). Different letters on top of the bars indicate significance difference at p<0.05 (Tukey post hoc test).
Figure 5
Figure 5. Concentration of individual glucosinolates in leaves from different Arabidopsis genotypes.
Error bars indicate standard deviations (n = 5). Characters on the error bars indicate significance groups (p<0.05, Tukey post hoc test). All values were determined as nmol per g fresh weight, except for glucoibarin and glucohesperin. The latter compounds were below the detection limit in the dedicated HPLC analysis, but could be analyzed from the LC-MS analysis. Therefore they are represented as ion counts (arbitrary units; a.u.).
Figure 6
Figure 6. Gene expression analysis of MYB genes and glucosinolate biosynthesis genes.
Indicated are the expression levels relative to those in the wild type on a logarithmic scale. Error bars indicate standard deviations (n = 3). Characters on the error bars indicate significance groups (p<0.05, Tukey post hoc test). The wild type values were always significance group “a”.
Figure 7
Figure 7. The effect of mutations in MYB genes on the interaction of Arabidopsis with Mamestra brassicae.
(A) Average larval weights on day 14 of the detached leaf experiment. Error bars indicate standard errors. Different characters over the bars indicate significant differences between the treatments after Tukey's unequal N HSD analysis (p<0.05). Col-0: n = 12; WT BRC_H161: n = 15; myb28 BRC_H161: n = 17; myb28 SALK_136312: n = 17; myb29: n = 18. WT BRC_H161 is a wild type segregant obtained from the self fertilized progeny of a heterozygous MYB28myb28 (BRC_H161) plant. myb28 BRC_H161 and myb28 SALK_H636 are homozygous myb28 mutants carrying the BRC_H161b or the SALK_136312 T-DNA insert. myb29 is a homozygous myb29 mutant carrying the SM3.34316 transposable element insert. (B) Pictures of representative larvae captured from different mutant lines on day 12 of the whole-leaf experiment. (C) Average larval weights on day 12 of the whole plant experiment. Error bars indicate standard errors. Different characters over the bars indicate significant differences between the treatments after Tukey's unequal N HSD analysis (p<0.05). Col-0: n = 24; myb28: n = 43; myb29: n = 51; myb28myb29: n = 53.
Figure 8
Figure 8. Plant damage after 10 days of Mamestra feeding.
(A) Ranking by five observers from 1 (lowest damage) to 7 (highest damage). Different characters over the bars indicate significant differences between the treatments after Kruskal-Wallis ANOVA followed by Multiple Comparison analysis (2-tailed). (B) Pictures of representative plants of wild type Col-0 and myb28myb29 on day 10 of Mamestra feeding.

References

    1. Kliebenstein DJ. Secondary metabolites and plant/environment interactions: a view through Arabidopsis thaliana tinged glasses. Plant Cell Environ. 2004;27:675–684.
    1. Wittstock U, Kliebenstein DJ, Lambrix V, Reichelt M, Gershenzon J. Glucosinolate hydrolysis and its impact on geenralist and specialist insect herbivores. In: Romeo JT, editor. Integrative Phytochemistry: from Ethnobotany to Molecular Ecology. Amsterdam: Pergamon; 2003. pp. 101–125.
    1. Fahey JW, Zalcmann AT, Talalay P. The chemical diversity and distribution of glucosinolates and isothiocyanates among plants. Phytochem. 2001;56:5–51. - PubMed
    1. Kelly PJ, Bones A, Rossiter JT. Sub-cellular immunolocalization of the glucosinolate sinigrin in seedlings of Brassica juncea. Planta. 1998;206:370–377. - PubMed
    1. Agrawal AA, Kurashige NS. A role for isothiocyanates in plant resistance against the specialist herbivore Pieris rapae. J Chem Ecol. 2003;29:1403–1415. - PubMed

MeSH terms