. 2008 Apr 30;3(4):e2069.
doi: 10.1371/journal.pone.0002069.

Pancreatic insulin content regulation by the estrogen receptor ER alpha

Affiliations

Pancreatic insulin content regulation by the estrogen receptor ER alpha

Paloma Alonso-Magdalena et al. PLoS One. .

Abstract

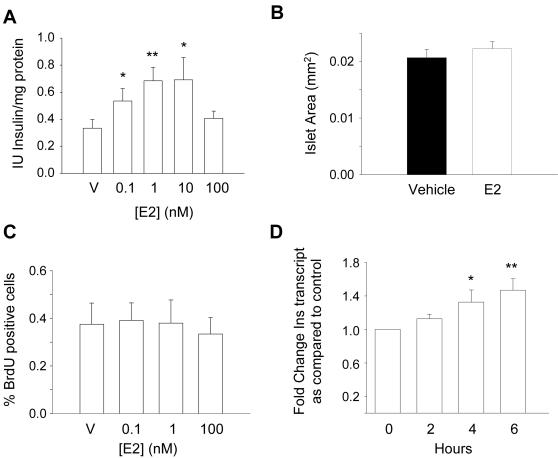
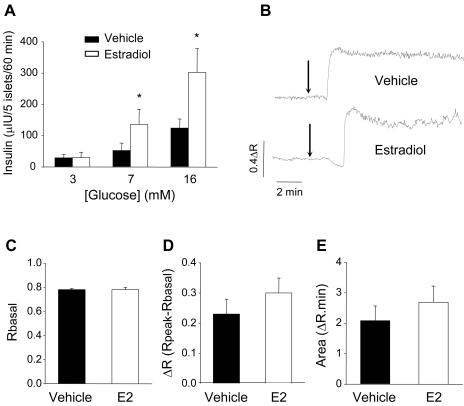
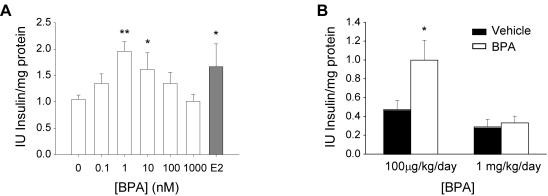
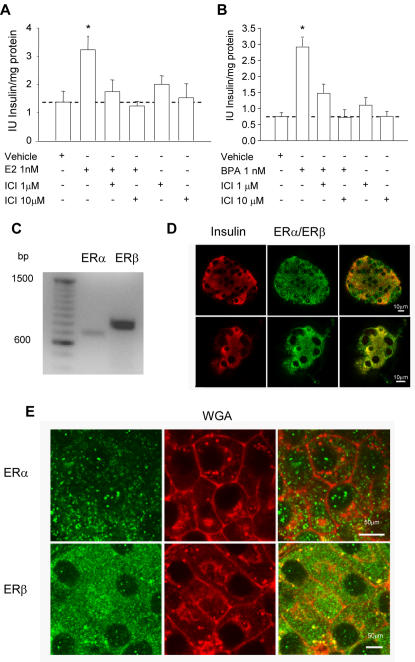
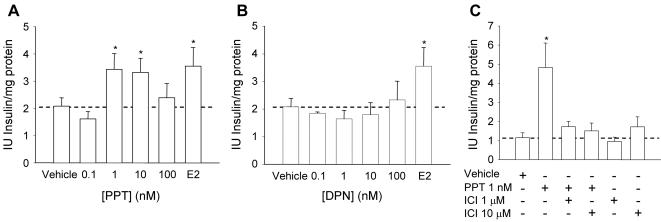
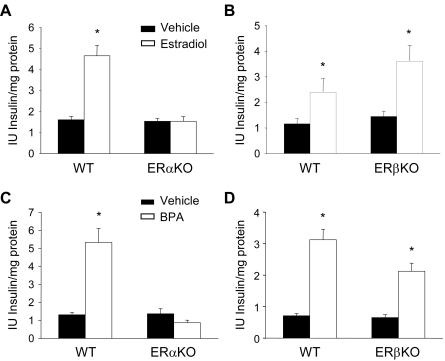
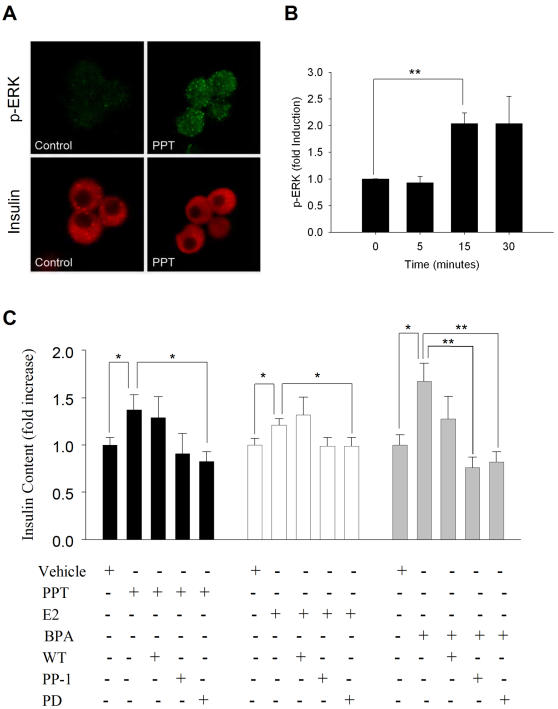
The function of pancreatic beta-cells is the synthesis and release of insulin, the main hormone involved in blood glucose homeostasis. Estrogen receptors, ER alpha and ER beta, are important molecules involved in glucose metabolism, yet their role in pancreatic beta-cell physiology is still greatly unknown. In this report we show that both ER alpha and ER beta are present in pancreatic beta-cells. Long term exposure to physiological concentrations of 17beta-estradiol (E2) increased beta-cell insulin content, insulin gene expression and insulin release, yet pancreatic beta-cell mass was unaltered. The up-regulation of pancreatic beta-cell insulin content was imitated by environmentally relevant doses of the widespread endocrine disruptor Bisphenol-A (BPA). The use of ER alpha and ER beta agonists as well as ER alphaKO and ER betaKO mice suggests that the estrogen receptor involved is ER alpha. The up-regulation of pancreatic insulin content by ER alpha activation involves ERK1/2. These data may be important to explain the actions of E2 and environmental estrogens in endocrine pancreatic function and blood glucose homeostasis.


Conflict of interest statement

Competing Interests: The authors have declared that no competing interests exist.

Figures

Figure 1
Figure 1. E2 action on insulin content, β-cell mass and insulin gene expression.
(A) Insulin content of islets exposed to increasing doses of E2 for 48 hours, V means vehicle, (n = 8, 8 mice), * p<0.05, ** p<0.01, Mann-Whitney test, compared to vehicle. (B) Average size of islets cultured in the presence of vehicle (black column) or 1 nM E2 (white column) for 48 hours. Data represent the mean±SEM of at least 60 islets per condition obtained from 5 different animals. (C) Dispersed islet cells were counted under a fluorescent microscope and results are depicted as a percentage of BrdU-positive cells, values represent the mean±SEM of 4 independent experiments, each representing 3000 cells per condition. (D) Rat pancreatic islets were incubated for up to 6 hours in the presence of 10 nM E2. RNA was subsequently isolated and insulin as well as cyclophilin transcript levels were evaluated by quantitative RT-PCR. Data are presented as fold change of mRNA levels as compared to control untreated islets and normalized to the cyclophilin transcript. Values represent the mean±SEM of 3 independent experiments performed in duplicates. Statistical significance was tested by Student's t test. *, P<0.05; **, P<0.01.
Figure 2
Figure 2. E2 action on insulin secretion and glucose-induced [Ca2+]i signals.
(A) Glucose-induced insulin secretion from islets exposed to vehicle (black column) or 1 nM E2 (white column) for 48 hours with 3, 7 and 16mM glucose. (n = 3, 5 mice), * p<0.05 Mann-Whitney test compared to vehicle. (B) Record of fluorescence vs. time from whole islets of Langerhans treated with either vehicle or E2 in the same conditions described for experiments in figures 1– 3. The Ca2+-dependent fluorescence of Fura-2 is expressed as the ratio F340/F380 (Materials and Methods). Stimuli were applied when indicated by arrows. (C) Comparison of the fluorescence levels in the absence of stimuli between vehicle and E2-treated islets. (D) Increment of fluorescence between the fluorescence levels at the peak obtained with high glucose (Rpeak) and the basal fluorescence (Rbasal). (E) Area under the traces during 10 minutes beginning when R increases in response to glucose. At least 8 islets were used from 3 different mice. Note that no significant differences were found.
Figure 3
Figure 3. BPA action in vitro and in vivo.
(A) Insulin content of islets exposed to increasing doses of BPA for 48 hours, (n = 4, 7 mice), * p<0.05. (B) Insulin content of islets obtained from two sets of experiments. First group: vehicle (black column) and BPA 100 µg/kg/day (white column) treated mice for four days. Second group: vehicle (black column) and BPA 1 mg/kg/day (white column) treated mice for four days (from at least 3 mice), * p<0.05.
Figure 4
Figure 4. Involvement of estrogen receptors in E2 regulation of insulin content.
(A) Insulin content obtained in cultured islets exposed to 1 nM E2 in the presence or absence of the antiestrogen ICI 182,780. (n≥4, from at least 4 mice), ** p<0.001, compared to vehicle. (B) Insulin content obtained in cultured islets exposed to 1 nM BPA in the presence or absence of the antiestrogen ICI 182,780. (n = 4, 8 mice), ** p<0.01, compared to vehicle. (C) RT-PCR of mRNA from fresh isolated islets was performed for both ERα and ERβ. (D) Confocal images of whole islets stained with anti-insulin (red) and anti-ERα or anti-ERβ (green). (E) ERα and ERβ subcellular localization. Single confocal images of whole islets stained with wheat germ agglutinin (red) as a marker for plasma membrane along with anti-ERα or anti-ERβ (green). Calibration bars represent 50 µm.
Figure 5
Figure 5. Action of ERα and ERβ agonists on insulin content.
(A) Insulin content of islets cultured for 48 hours in the presence of increasing doses of the ERα-selective agonist PPT. The bar labeled E2 represents islets cultured with 1 nM E2 for 48 hours. Note that PPT increases insulin content in an inverted-U dependent manner and its potency is in the same range as E2 (n = 5, 7 mice), * p<0.05. (B) The ERβ-selective agonist DPN has no effect at doses from 0.1–100 nM. The bar labeled E2 represents islets cultured with 1 nM E2 for 48 hours (n = 4, from at least 5 mice), * p<0.05. (C) Insulin content regulation by PPT in the presence and absence of ICI182,780 (n = 4, from at least 6 mice), * p<0.05.
Figure 6
Figure 6. E2 effect on insulin content in ERαKO and ERβKO mice.
(A) Insulin content obtained in cultured islets from wild-type and ERαKO mice exposed to either vehicle or 1 nM E2. Data obtained from 4 animals for experiments performed with wild-type mice and from 6 animals for experiments performed with KO mice, *p<0.001 compared to vehicle (B) Insulin content obtained in cultured islets from wild-type and ERβKO mice exposed to either vehicle or 1 nM E2. Data obtained from 2 animals for experiments performed with wild-type mice and 2 animals for experiments performed with KO mice, *p<0.05 compared to vehicle (C) Insulin content obtained in cultured islets from wild-type and ERαKO mice exposed to either vehicle or 1 nM BPA. Data from 4 animals for experiment performed with wild-type mice and 3 animals for experiment performed with KO mice, *p<0.001 compared to vehicle (D) Insulin content obtained in cultured islets from wild-type and ERβKO mice exposed to either vehicle or 1 nM BPA. Data from 4 animals for experiment performed with wt mice and 4 animals for experiment performed with KO mice, *p<0.001 compared to vehicle.
Figure 7
Figure 7. Implication of ERK1/2 in ERα action.
A) Levels of ERK1/2 activation. Isolated β-cells were treated with the ERα specific agonist PPT for 0 (Control), 5, 15 and 30 min (PPT). Cells were fixed, permeabilized and incubated with antibodies to phospho-ERK1/2 (in green, p-ERK) and to insulin (in red, Insulin). Fluorescence images were registered with a confocal laser microscopy system. (B) Fluorescence intensity per cell was quantified as described in Materials and Methods. The histogram shows the fold increase in fluorescence intensity with respect to control (0 min). Data are pooled from 4 different experiments. Fluorescence intensity was obtained from at least 200 cells per condition in each experiment. *p = 0.01 Student's t-test comparing with column at 0 min. (C) Insulin content obtained in cultured islets exposed to either vehicle or 1 nM PPT (black columns), E2 (white columns) and BPA (grey columns) in the presence of the PI3Kinase inhibitor wortmannin (100 nM), the c-Src inhibitor PP-1 (10 µM) and the ERK1/2 inhibitor PD98059 (10 µM). Data were obtained from at least 4 independent experiments in duplicate using islets from at least 7 different mice. Data are expressed as fold change as compared to vehicle. *p<0.05, **p<0.01 Student's t-test comparing pairs marked by lines.

References

    1. Ropero AB, Alonso-Magdalena P, Quesada I, Nadal A. The role of estrogen receptors in the control of energy and glucose homeostasis. Steroids. 2007:doi:10.1016/j.steroids.2007.12.018 [Online 27 December 2007]. - PubMed
    1. Heine PA, Taylor JA, Iwamoto GA, Lubahn DB, Cooke PS. Increased adipose tissue in male and female estrogen receptor-alpha knockout mice. Proc Natl Acad Sci U S A. 2000;97:12729–12734. - PMC - PubMed
    1. Le May C, Chu K, Hu M, Ortega CS, Simpson ER, et al. Estrogens protect pancreatic beta-cells from apoptosis and prevent insulin-deficient diabetes mellitus in mice. Proc Natl Acad Sci U S A. 2006;103:9232–9237. - PMC - PubMed
    1. Rochira V, Balestrieri A, Madeo B, Spaggiari A, Carani C. Congenital estrogen deficiency in men: a new syndrome with different phenotypes; clinical and therapeutic implications in men. Mol Cell Endocrinol. 2002;193:19–28. - PubMed
    1. Jones MEE, Thorburn AW, Britt KL, Hewitt KN, Wreford NG, et al. Aromatase-deficient (ArKO) mice have a phenotype of increased adiposity. Proc Natl Acad Sci U S A. 2000;97:12735–12740. - PMC - PubMed

Publication types

MeSH terms