

A flexible nonlinear feedback system that captures diverse patterns of adaptation and rebound
- PMID: 18446507
- PMCID: PMC2751452
- DOI: 10.1208/s12248-008-9007-x
A flexible nonlinear feedback system that captures diverse patterns of adaptation and rebound
Abstract
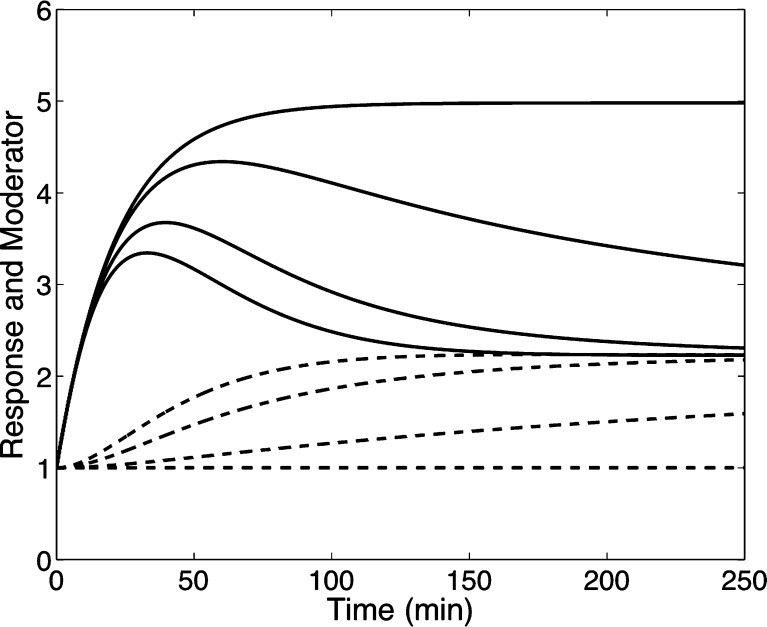
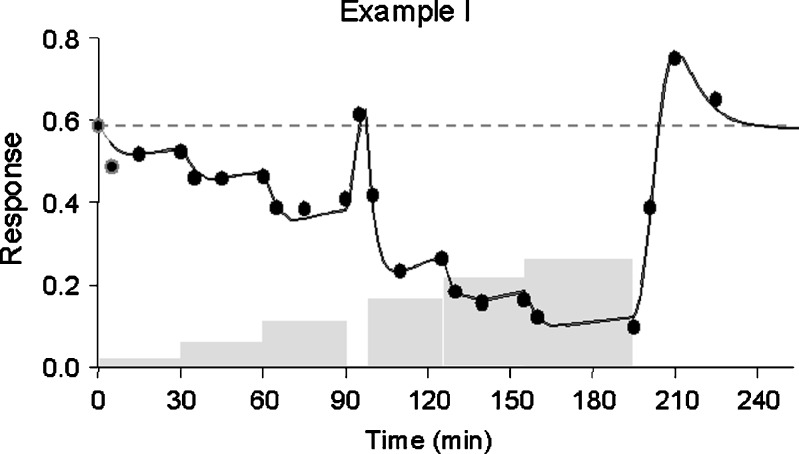
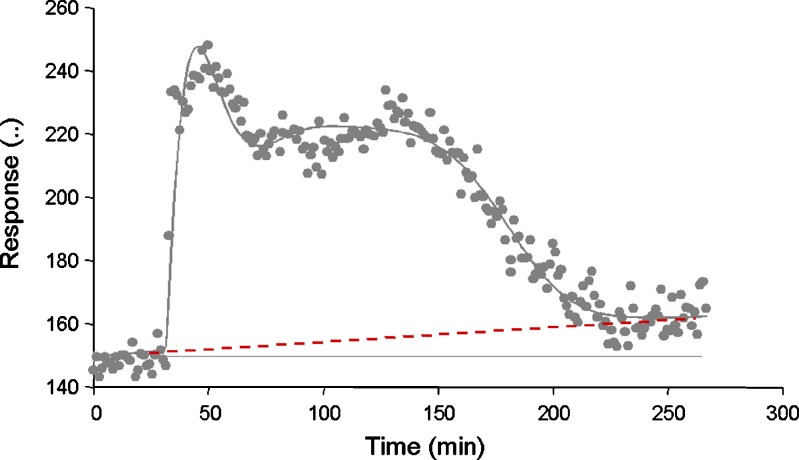
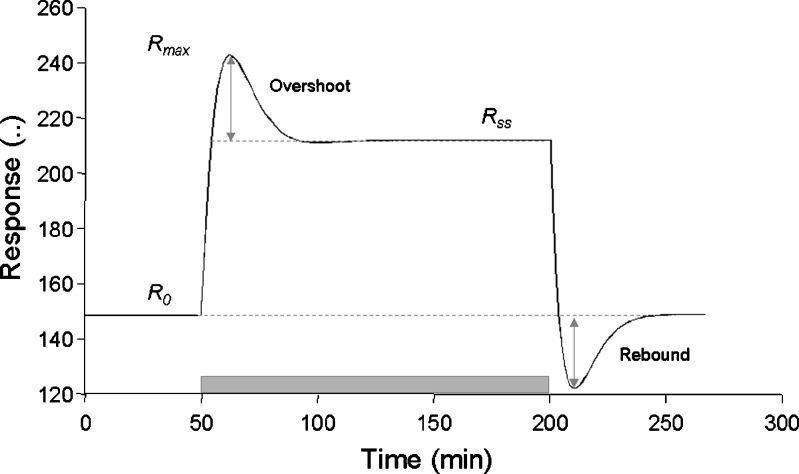
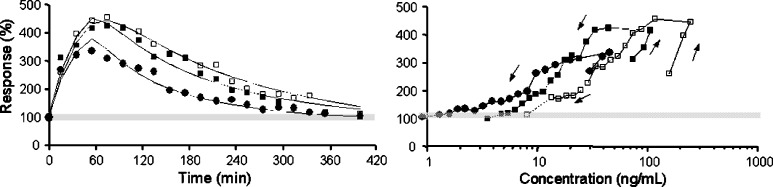
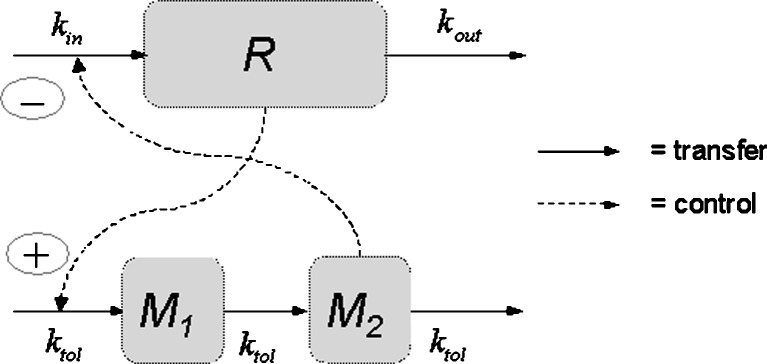
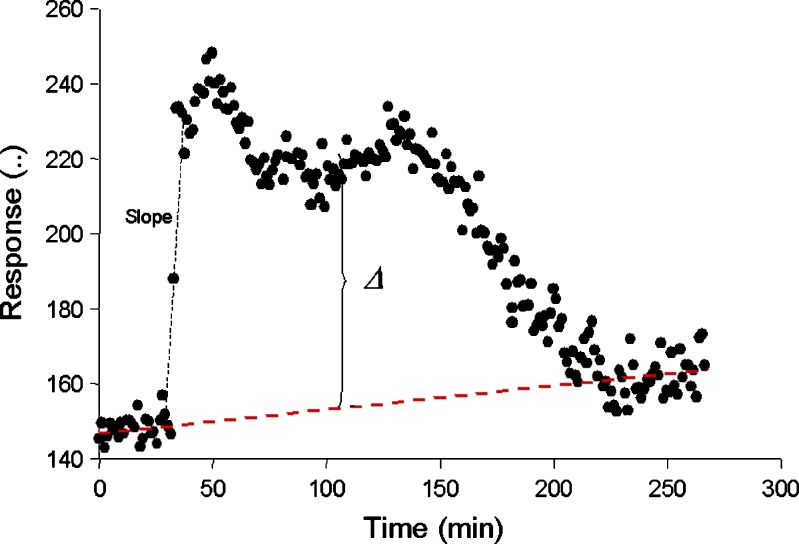
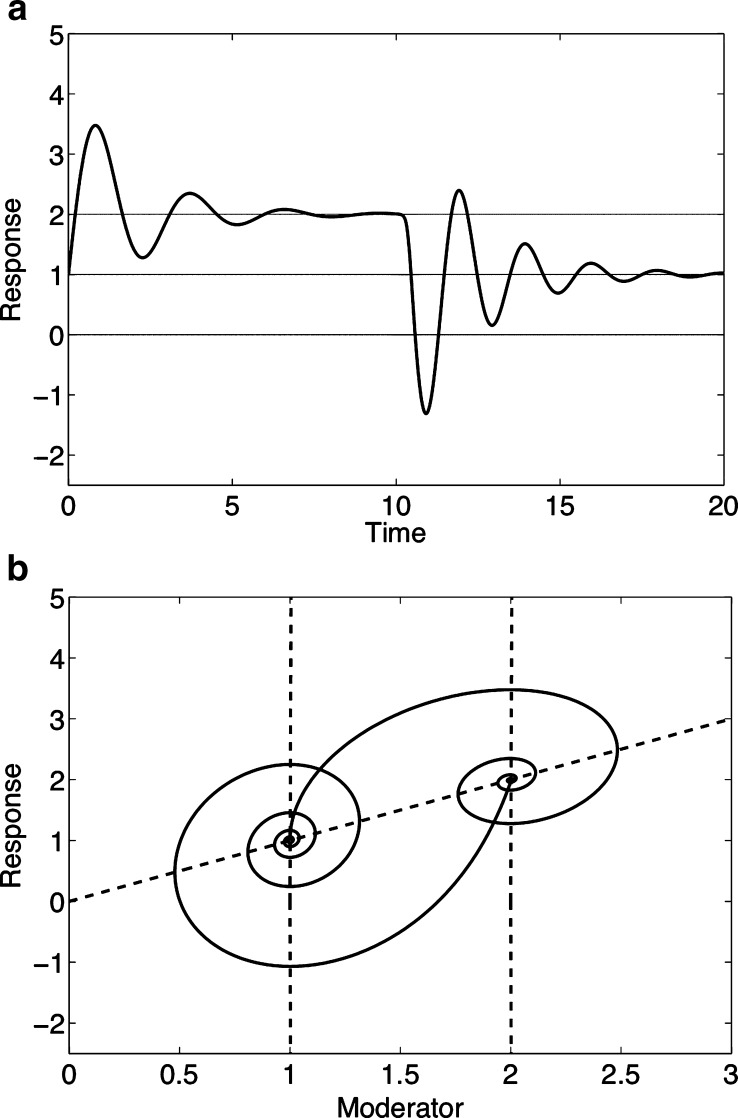
An important approach to modeling tolerance and adaptation employs feedback mechanisms in which the response to the drug generates a counter-regulating action which affects the response. In this paper we analyze a family of nonlinear feedback models which has recently proved effective in modeling tolerance phenomena such as have been observed with SSRI's. We use dynamical systems methods to exhibit typical properties of the response-time course of these nonlinear models, such as overshoot and rebound, establish quantitive bounds and explore how these properties depend on the system and drug parameters. Our analysis is anchored in three specific in vivo data sets which involve different levels of pharmacokinetic complexity. Initial estimates for system (k(in), k(out), k(tol)) and drug (EC(50)/IC(50), E(max)/I(max), n) parameters are obtained on the basis of specific properties of the response-time course, identified in the context of exploratory (graphical) data analysis. Our analysis and the application of its results to the three concrete examples demonstrates the flexibility and potential of this family of feedback models.
Figures


Similar articles
-
A nonlinear feedback model capturing different patterns of tolerance and rebound.Eur J Pharm Sci. 2007 Oct;32(2):85-104. doi: 10.1016/j.ejps.2007.06.001. Epub 2007 Jun 13. Eur J Pharm Sci. 2007. PMID: 17689227
-
Quantitative analysis of rate and extent of tolerance of biomarkers: application to nicotinic acid-induced changes in non-esterified fatty acids in rats.Eur J Pharm Sci. 2011 Oct 9;44(3):250-64. doi: 10.1016/j.ejps.2011.08.005. Epub 2011 Aug 11. Eur J Pharm Sci. 2011. PMID: 21856416
-
Adaptive neural control for a class of strict-feedback nonlinear systems with state time delays.IEEE Trans Neural Netw. 2009 Jul;20(7):1209-15. doi: 10.1109/TNN.2009.2022159. Epub 2009 May 15. IEEE Trans Neural Netw. 2009. PMID: 19447725
-
Chaos and physiology: deterministic chaos in excitable cell assemblies.Physiol Rev. 1994 Jan;74(1):1-47. doi: 10.1152/physrev.1994.74.1.1. Physiol Rev. 1994. PMID: 8295931 Review.
-
An overview of adaptive model theory: solving the problems of redundancy, resources, and nonlinear interactions in human movement control.J Neural Eng. 2005 Sep;2(3):S279-312. doi: 10.1088/1741-2560/2/3/S10. Epub 2005 Aug 31. J Neural Eng. 2005. PMID: 16135890 Review.
Cited by
-
Feedback modeling of non-esterified fatty acids in rats after nicotinic acid infusions.J Pharmacokinet Pharmacodyn. 2011 Feb;38(1):1-24. doi: 10.1007/s10928-010-9172-2. Epub 2010 Nov 4. J Pharmacokinet Pharmacodyn. 2011. PMID: 21046209 Free PMC article.
-
Challenges of a mechanistic feedback model describing nicotinic acid-induced changes in non-esterified fatty acids in rats.J Pharmacokinet Pharmacodyn. 2013 Aug;40(4):497-512. doi: 10.1007/s10928-013-9325-1. Epub 2013 Jul 4. J Pharmacokinet Pharmacodyn. 2013. PMID: 23824920
-
Feedback control indirect response models.J Pharmacokinet Pharmacodyn. 2016 Aug;43(4):343-58. doi: 10.1007/s10928-016-9479-8. Epub 2016 Jul 9. J Pharmacokinet Pharmacodyn. 2016. PMID: 27394724
-
Turnover modeling of non-esterified fatty acids in rats after multiple intravenous infusions of nicotinic acid.Dose Response. 2009 Apr 8;7(3):247-69. doi: 10.2203/dose-response.08-028.Isaksson. Dose Response. 2009. PMID: 19809543 Free PMC article.
-
In Vitro-In Silico Models to Elucidate Mechanisms of Bile Acid Disposition and Cellular Aerobics in Human Hepatocytes.AAPS J. 2025 Feb 28;27(2):51. doi: 10.1208/s12248-024-01010-9. AAPS J. 2025. PMID: 40016501
References
-
- Goodman L. S., Gilman A. G. The Pharmacological Basis of Therapeutics. 9. New York: McGrawHill; 1996.
-
- Sällström B., Visser S. A. G., Forsberg T., Peletier L. A., Ericson A. C., Gabrielsson J. A novel pharmacodynamic turnover model capturing asymmetric circadian baselines of body temperature, heart rate and blood pressure in rats: challenges in terms of tolerance and animal handling effects. Journal of Pharmacokinetics and Pharmacodynamics. 2005;32:835–859. doi: 10.1007/s10928-005-0087-2. - DOI - PubMed
-
- Visser S. A. G., Sällström B., Forsberg T., Peletier L. A., Gabrielsson J. Modeling drug- and system-related changes in body temperature: application to Clometiazole-induced hypotyhermia, long-lasting tolerance developments and circadian rhythm in rats. J. Pharmacol. Exp. Ther. 2006;317:209–219. doi: 10.1124/jpet.105.095224. - DOI - PubMed
-
- Colburn W. A., Eldon M. A. Simultaneous pharmacokinetic/Pharmacodynamic modeling. In: Butler N. R., Sramek J. J., Narang P. K., editors. Pharmacodynamics and Drug Development: Perspectives in Clinical Pharmacology. New York: Wiley; 1994.
-
- Porchet H. C., Benowitz N. L., Sheiner L. B. Pharmacodynamic model of tolerance: Application to nicotine. J. Pharmacol. Exp. Ther. 1988;244:231–236. - PubMed
Publication types
MeSH terms
Substances
LinkOut - more resources
Full Text Sources
