. 2008 Aug;8(3):265-75.
doi: 10.1007/s10142-008-0082-y. Epub 2008 May 1.

Integrated transcriptomic response to cardiac chronic hypoxia: translation regulators and response to stress in cell survival

Affiliations

Integrated transcriptomic response to cardiac chronic hypoxia: translation regulators and response to stress in cell survival

Dumitru A Iacobas et al. Funct Integr Genomics. 2008 Aug.

Abstract

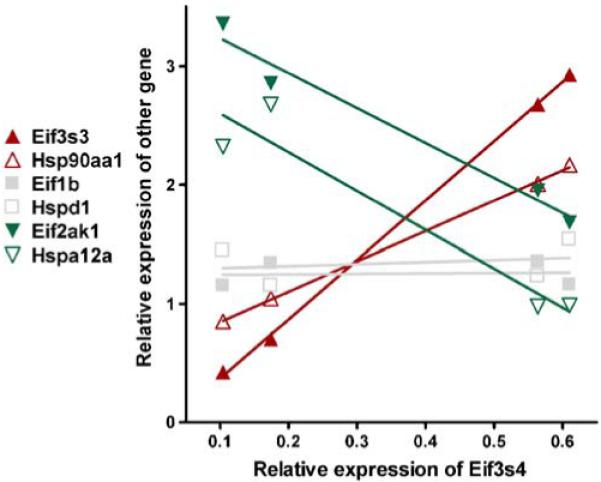
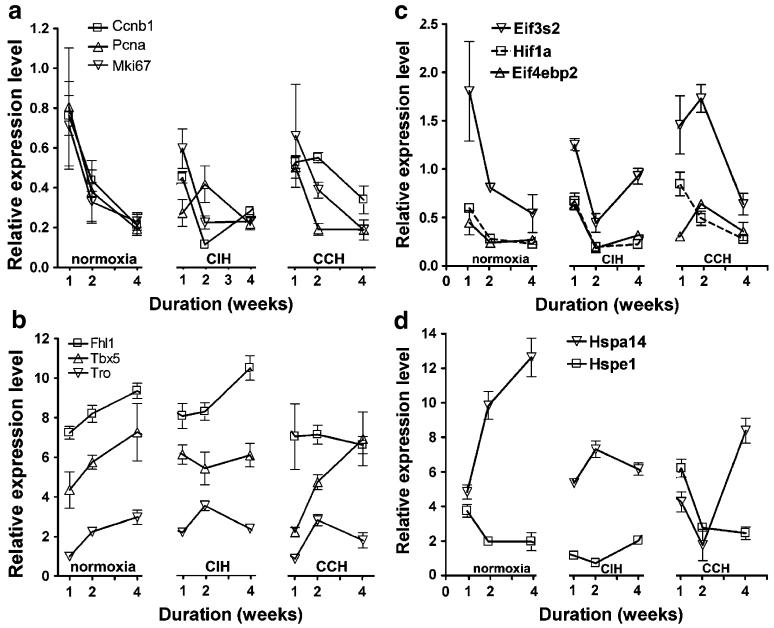
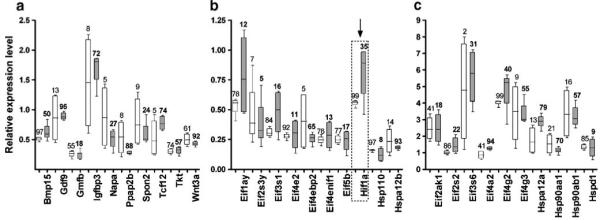
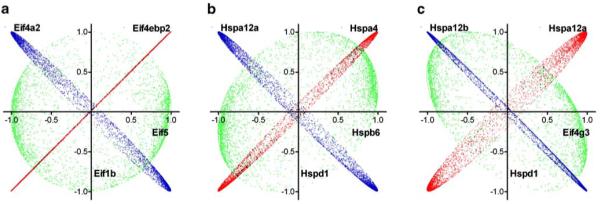
Complementary deoxyribonucleic acid microarray data from 36 mice subjected for 1, 2, or 4 weeks of their early life to normal atmospheric conditions (normoxia) or chronic intermittent (CIH) or constant (CCH) hypoxia were analyzed to extract organizational principles of the developing heart transcriptome and determine the integrated response to oxygen deprivation. Although both CCH and CIH regulated numerous genes involved in a wide diversity of processes, the changes in maturational profile, expression stability, and coordination were vastly different between the two treatments, indicating the activation of distinct regulatory mechanisms of gene transcription. The analysis focused on the main regulators of translation and response to stress because of their role in the cardiac hypertrophy and cell survival in hypoxia. On average, the expression of each heart gene was tied to the expression of about 20% of other genes in normoxia but to only 8% in CCH and 9% in CIH, indicating a strong decoupling effect of hypoxia. In contrast to the general tendency, the interlinkages among components of the translational machinery and response to stress increased significantly in CIH and much more in CCH, suggesting a coordinated response to the hypoxic stress. Moreover, the transcriptomic networks were profoundly and differently remodeled by CCH and CIH.


Figures

Fig. 1
Fig. 1
Examples of genes encoding eukaryotic transcription initiation factors (Eif) and heat shock proteins (Hsp) that are synergistically (Eif3s3 and Hsp90aa1), antagonistically (Eif2ak1 and Hspa12a), or independently (Eif1b and Hspd1) expressed with eukaryotic translation initiation factor 3, subunit 4 delta (Eif3s4) in heart of 1-week normoxic mouse. The relative expression levels in the four biological replicas of the indicated gene in the left-hand panel are plotted against those of Eif3s4. Genes: Eif1b Eukaryotic translation initiation factor 1B, Eif2ak1 eukaryotic translation initiation factor 2 alpha kinase 1, Eif3s3 eukaryotic translation initiation factor 3, subunit 3 (gamma), Eif3s4 eukaryotic translation initiation factor 3, subunit 4 (delta), Hsp90aa1 heat shock protein 90-kDa alpha (cytosolic), class A member 1, Hsp12a heat shock protein 12A, Hspd1 heat shock protein 1 (chaperonin)
Fig. 2
Fig. 2
Expression regulation. a Percentage of significantly regulated genes when comparing the three conditions. Note that substantial percentages of the quantified genes were differently expressed between CCH and CIH. b Examples of genes involved in translation regulation and response to stress that are differently expressed between CCH and CIH at each time point. c Gender differences in the fold change of the genes regulated by constant (CCH) and intermittent (CIH) hypoxia treatments with respect to the corresponding normoxia. Note that females responded with higher regulation at 1-week CCH and CIH and with lower regulation at 2-week CCH and CIH and 4-week CCH
Fig. 3
Fig. 3
Examples of genes with significant change of maturational profile during the three treatments. a Growth-development genes. b Cell cycle regulators. c Eukaryotic translation initiation factors. For comparison, we added the profile of Hif1a. Note the similarity of maturational profiles of Hif1a and Eif4ebp2 in normoxia and CIH and the substantial difference in CCH. d Heat shock proteins. Note that each hypoxia treatment alters the maturational profiles and that the alterations are different. Genes (GO biological process): Fhl1 Four and a half LIM domains 1 (cell growth), Tbx5 T-box 5 (heart development), Tro trophinin (negative regulation of cell growth), Ccnb1 cyclin B1 (cell cycle), Pcna proliferating cell nuclear antigen (DNA replication), Mik67 antigen identified by monoclonal antibody Ki 67 (cell proliferation)
Fig. 4
Fig. 4
Variability of the expression levels at one week normoxia (open bars) and 1-week CCH (solid bars) of some: a growth development aging genes. b Low expressed eukaryotic translation initiation factors (Eif) and Heat shock proteins (Hsp). c High expressed Eifs and Hsps. Values on the vertical axis represent the ratio between the normalized background subtracted fluorescence signal of the probed gene transcript within the redundancy group for both slides and both channels and the average signal of all probed gene transcripts in all four samples, while values above the 95% confidence intervals (rectangles) are the GES percentiles of the respective genes. Note the nonuniform dispersion of the expression levels among the genes and the change of the expression stability in CCH (values in bold letters). Genes (GO biological process): Bmp15 Bone morphogenetic protein 15 (growth factor activity), Gdf9 growth differentiation factor 9 (growth factor activity), Gmfb glia maturation factor beta (growth factor activity), Igfbp3 insulin-like growth factor binding protein 3 (growth factor binding), Napa N-ethylmaleimide sensitive fusion protein attachment protein alpha (brain development), Ppap2b phosphatidic acid phosphatase type 2B (blood vessel development), Spon2 Spondin2 extracellular matrix (development), Tcf12 transcription factor 12 (development), Tkt transketolase (regulation of growth), Wnt3a wingless-related MMTV integration site 3A (axonogenesis)
Fig. 5
Fig. 5
a Part of the transcription networks at 1-week normoxia, CCH, and CIH. Red lines indicate synergistic expression and blue line antagonistic expression of the linked genes. Note the remodeling of the network in CIH and CCH and the substantial increase of the interlinkages among the selected genes in hypoxia
Fig. 6
Fig. 6
Examples of gene pairs with striking similarity, opposition, and neutrality as coordination profiles at 1-week normoxia. Values on the two axes represent the pairwise Pearson correlation coefficients between the logs of the relative expression levels in the four biological replicas of the indicated genes and each other gene of the sampled transcriptome. In each graph, the coordination profiles of three genes were plotted against that of the gene indicated on the abscissa. Eif1b Eukaryotic translation initiation factor 1b, Eif4a2 eukaryotic translation initiation factor 4A2, Eif4ebp2 eukaryotic translation initiation factor 4E binding protein 2, Eif4g3 eukaryotic translation initiation factor 4 gamma, 3, Eif5 eukaryotic translation initiation factor 5, Hspa4 heat shock protein 4, Hsp12a heat shock protein 12A, Hsp12b heat shock protein 12B, Hspb6 heat shock protein, alpha-crystallin-related, B6; Hspd1 heat shock protein 1 (chaperonin). The overlaps of the coordination profiles (OVL) are: [Table: see text]
Fig. 7
Fig. 7
The “see-saw” model of transcriptomic recovery. a. Positive (Gene Y) and negative (Gene Z) partners of gene X. Values on the two axes are the Pearson correlation coefficients between the logs of the expression levels within biological replicas of the indicated gene and each other quantified gene. b-c Predictive value of the coordination analysis. Genes that are synergistically expressed with gene X in wild-type tissues (correl with X>0) are most prone to be downregulated (negative fold change) in gene X null tissues and genes antagonistically expressed (correl with X<0) are most likely to be upregulated in X-null tissues. d Restorative effect of “see-saw” partners. Over-expression of a gene with striking similarity (Y) or underexpression of one with striking opposition (Z) as coordination profile with X in wild types are expected to have a restorative effect on gene expression levels in X-null tissues

Similar articles

Cited by

References

    1. Abe K, Tawara S, Oi K, Hizume T, Uwatoku T, Fukumoto Y, Kaibuchi K, Shimokawa H. Long-term inhibition of Rho-kinase ameliorates hypoxia-induced pulmonary hypertension in mice. J Cardiovasc Pharmacol. 2006;48(6):280–285. - PubMed
    1. Ahmad S, Tang W, Chang Q, Qu Y, Hibshman J, Li Y, Söhl G, Willecke K, Chen P, Lin X. Restoration of connexin26 protein level in the cochlea completely rescues hearing in a mouse model of human connexin30-linked deafness. Proc Natl Acad Sci USA. 2007;104(4):1337–1341. - PMC - PubMed
    1. Alam I, Lewis K, Stephens JW, Baxter JN. Obesity, metabolic syndrome and sleep apnoea: all pro-inflammatory states. Obes Rev. 2007;8(2):119–127. Review. - PubMed
    1. Azfer A, Niu J, Rogers LM, Adamski FM, Kolattukudy PE. Activation of endoplasmic reticulum stress response during the development of ischemic heart disease. Am J Physiol Heart Circ Physiol. 2006;1(3):H1411–H1420. - PMC - PubMed
    1. Baker JE. Oxidative stress and adaptation of the infant heart to hypoxia and ischemia. Antioxid Redox Signal. 2004;6(2):423–429. Review. - PubMed

Publication types