Comparative Study
. 2008;18(8):737-49.
doi: 10.1002/hipo.20430.

Nicotinic acetylcholine receptor expression in the hippocampus of 27 mouse strains reveals novel inhibitory circuitry

Affiliations
Comparative Study

Nicotinic acetylcholine receptor expression in the hippocampus of 27 mouse strains reveals novel inhibitory circuitry

Lorise C Gahring et al. Hippocampus. 2008.

Abstract

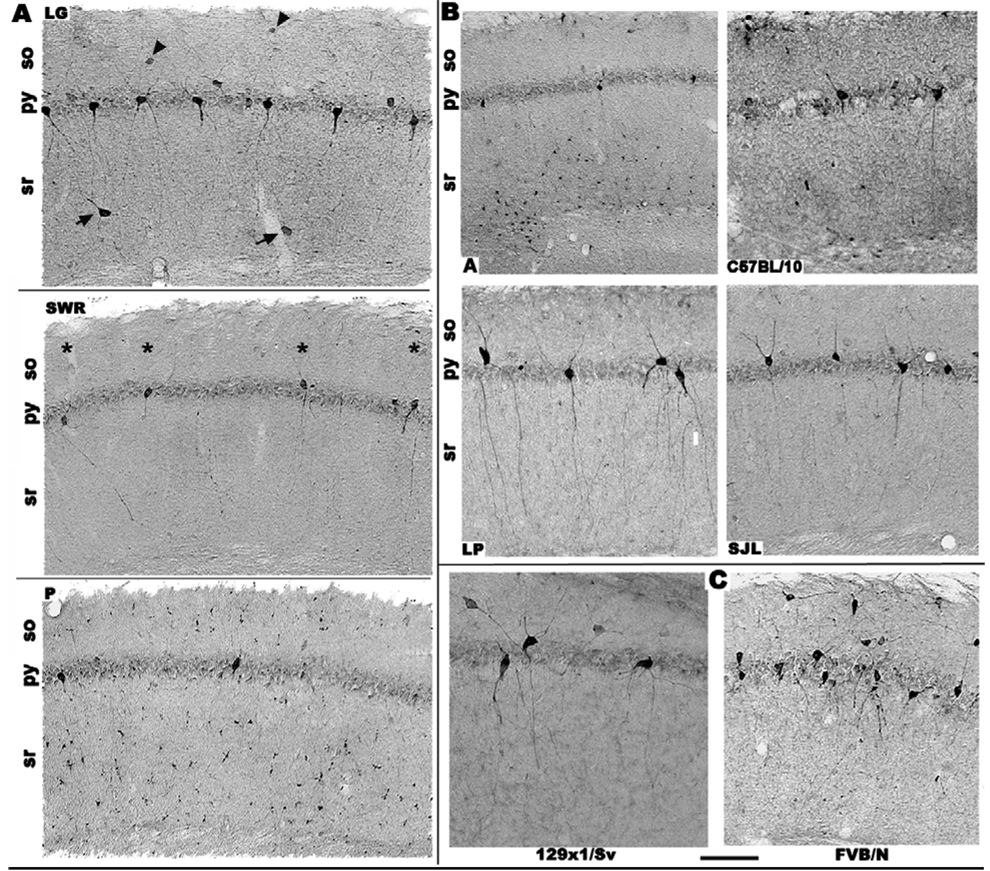
Mouse strains are well-characterized to exhibit differences in their physiological and behavioral responses to nicotine. This report examines the expression of the high-affinity nicotine binding receptor subunit, neuronal nicotinic receptor subunit alpha 4 (nAChR alpha 4), in the dorsal hippocampus of 27 inbred mouse strains. Multiple differences among mouse strains in the cellular expression of nAChR alpha 4 between subregions of the hippocampal field are evident. Differences that we describe in the expression of nAChR alpha 4 suggest mouse strains of diverse genetic origin could exhibit significant variation in how this receptor contributes to modulating intrahippocampal circuitry. These findings define a genetic frame-work in which the strain-specific responses to nicotine include underlying contributions by the varied anatomical context in which nAChRs are expressed.


Figures

Figure 1
Figure 1. The expression of nAChRα4 in the dorsal hippocampus varies between mouse strains
Typical immunostaining for nAChRα4 in the dorsal hippocampus of indicated strains. Panel A. A diagram of the dorsal aspect of the hippocampus taken from (Franklin and Paxinose, 2008) with modification. Coronal sections were collected from the location approximated on the sagittal drawing by a black line (inset). The coronal section shows boundaries of the respective subregions (arrow heads; see text). For the dentate gyrus, the area engulfed by the fascia dentate (hilar region) is included minus the cells counted within the interceding cells of the CA3 pyramidal layer. Anatomical definitions are: fbr, fimbria; ec external capsule; DG, dentate gyrus, and hippocampal subfields, CA1, CA2 and CA3, respectively. Subregions of CA1 are defined as; py, pyramidal layer; so, stratum oriens; sr, stratum radiatum; and slm, stratum lucunosum moleculare. For the dentate gyrus (DG) the granule cell, gc; hilar, hi and molecular layer (ml) is indicated. Finally, the CA3 pyramidal layer is marked. Panel B. A section from the strains indicated (A) is stained for nAChRα4 and matched approximately to the diagram in Panel A. Strain-expression is seen in all major subdivisions of the hippocampus (arrows and arrowheads), although the most prominently stained neuronal-like cells are associated with the dentate gyrus (hr and granule cell layers) and the pyramidal layer (Py) of CA1. Panel C. Images comparing similar coronal sections taken of a portion of the hippocampal field from the SJL, AKR and P strains, respectively. The quantitative and qualitative differences in expression for this nAChR subunit were measured from similar sections prepared from 27 strains. Labels indicating anatomic definitions are to the left. All bars = 100 microns.
Figure 2
Figure 2
Graphic presentation of data from Table 1 showing the relative quantitative distribution of nAChRα4+ interneurons and astrocytes in different mouse strains. The data are organized according to major subdivisions of the hippocampal field, genetic group relatedness as indicated (see (Petkov et al., 2004)) and in order of increasing numbers of stained neurons in the CA1 region. All values are the mean +/− the standard error of the mean.
Figure 3
Figure 3
Mouse family tree generated from combining the strains from genetic groups (Table 1 and (Petkov et al., 2004)) and Pearson correlation values for nAChRα4 expression the hippocampus (see text). Examples of the staining distribution for nAChRα4 in CA1 for each strain are also shown for reference. The program PhyloDraw was used to generate the tree. The length and distances of branches between strains are arbitrary. Group anchor strains (Petkov et al., 2004) are boxed. Abbreviations are as in Figure 1. Bar = 100 microns.
Figure 4
Figure 4
Examples of strain-related differences in nAChRα4 expression in CA1. Panel A. Examples of nAChRα4 expression in CA1 are shown for three strains as indicated. Notable staining of pyramidal-associated interneurons (py-int) in the LG strain is observed that in some sections exhibits remarkable regularity (asterisks). There are few stained astrocytes and regularly spaced neurons in the stratum radiatum (sr; approximately 100–150 micron intervals) are identified (arrows). Occasional cells in the stratum oriens (so) are also seen (arrowhead). Some strains, such as SWR exhibit fewer py-int, although these may also be distributed at regular intervals across the pyramidal layer (astrisks). Stained cells in the sr and so are infrequent in this section. The P strain shows occasional py-int neurons with occasional spacing reminiscent to that of SWR, although far less frequent. This strain (also shown in Figure 1) exhibits the greatest density of astrocytes in the sr and so and the fewest nAChRα4+ interneurons. Panel B. Examples of additional strains (as indicated) show the diversity in cell morphology and patterns of nAChRα4 expression encountered. The strains in the upper part of this section exhibit well-spaced py-int cells, many astrocytes and relatively limited arborization of neuronal processes. The A strain also exhibits predominate accumulation of stained astrocytes in the CA1 sr near the border with the stratum lacunosum moleculare. In contrast, LP and SJL each reflect strains rich in py-int staining and few nAChRα4+ astrocytes. Again, these neurons show regular spacing and are characterized by extensive arbors that are well defined. Panel C. The expression nAChRα4 in the CA1 region of two strains frequently used for generation of genetically modified mice, 129 and FVB/N. The 129 exhibits a limited nAChRα4 pattern of py-int expression that usually lacks the regularity suggested by this image. FVB/N is rich in stained interneurons, but the pattern of expression might be described as chaotic. Also, astrocytes that are nAChRα4+ are rare in these backgrounds. Bar in Panel C = 100 microns for all photos except Panel B; strain A where it is 150 microns.
Figure 5
Figure 5
Strain-specific CA1 nAChRα4+ interneuron:astrocyte ratios are inversely related. The percent of the total nAChRα4+ hippocampal CA1 interneurons plotted against the stained astrocyte ratio as derived from values in Table 1 is shown. The highly significant inverse relationship (p<0.001) between these parameters is similar to that reported previously (Gahring et al., 2004a; Gahring et al., 2004b; Gahring et al., 2005). Some strains are identified for internal reference. Error bars reflect the mean +/− the standard error of the mean for each strain measurement.
Figure 6
Figure 6
Examples of strain-related differences in nAChRα4 expression in the dentate gyrus. Panel A. The expression of nAChRα4 in the dentate gyrus of three strains (as indicated) shows the diversity of staining, particularly in interneurons of the hilar region. Bar = 200 microns; gc=granule cell layer; ml = molecular layer. Panel B. Increased magnification of the dentate gyrus of YBR/Ei, AKR and LG mice illustrates the often dramatic difference in nAChRα4 expression by interneurons of the molecular layer. Similar to CA1, the nAChRα4+ dentate gyrus interneurons occur at regular intervals (asterisks) although their location in the granule cell layer or molecular layer is dependent upon the strain. Also shown are strains that exhibit nAChRα4 expression in the inner molecular layer (IML) as for AKR or the outer molecular layer (OML) as for LG. Bar = 100 microns. Panel C. Shown are various examples of the morphology of molecular layer cells positive for nAChRα4 expression. As seen in these examples, the stained interneurons appear morphologically and anatomically heterogeneous (see text). Bars = 35 microns for SWR and AKR and 60 microns for BUB/Bn and P.
Figure 7
Figure 7
Inter-regional definition of nAChRα4 differences in the hippocampal formation varies according to genetic relatedness. In these diagrams the data from Table 1 are combined based upon genetic and nAChRα4+ expression similarities such as cells in dentate gyrus (DG) outer molecular cells (+or -OML) and CA1 astrocytes (+ or - Ast). The relative ratio of nAChRα4+ neurons (N) or astrocytes (Ast) among hippocampal subregions (arrows) is shown above the arrow and the Pearson correlation coefficient for this relationship below the arrow. Solid arrows reflect statistically significant relationships (p<0.05; P-values boxed). All strains display a significant correspondence between the number of nAChRα4+ interneurons of (DG) and CA3. However, between CA3 and CA1 there is a notable difference between these groups in the relative organization of nAChRα4+ expression between these respective hippocampal subregions. These differences suggest that the contribution of this receptor to modulating neurotransmission in the hippocampus will not necessarily be the same among these respective mouse strain groups (see text).

Similar articles

Cited by

References

    1. Adams CE, Stitzel JA, Collins AC, Freedman R. Alpha7-nicotinic receptor expression and the anatomical organization of hippocampal interneurons. Brain Res. 2001 Feb;922:180–190. - PubMed
    1. Alkondon M, Albuquerque EX. A non-alpha7 nicotinic acetylcholine receptor modulates excitatory input to hippocampal CA1 interneurons. J Neurophysiol. 2002;87(3):1651–1654. - PubMed
    1. Alkondon M, Albuquerque EX. The nicotinic acetylcholine receptor subtypes and their function in the hippocampus and cerebral cortex. Prog Brain Res. 2004;145:109–120. - PubMed
    1. Altavista MC, Gozzo S, Iacopino C, Albanese A. A genetic study of neostriatal cholinergic neurones in C57BL/6 and DBA/2 mice. Funct Neurol. 1987;2(3):273–279. - PubMed
    1. Bovet D, Bovet-Nitti F, Oliverio A. Effects of nicotine on avoidance conditioning of inbred strains of mice. Psychopharmacologia. 1966;10(1):1–5. - PubMed

Publication types

Substances