. 2008 Apr;79(4):044302.
doi: 10.1063/1.2906228.

Magnetic microposts for mechanical stimulation of biological cells: fabrication, characterization, and analysis

Affiliations

Magnetic microposts for mechanical stimulation of biological cells: fabrication, characterization, and analysis

Nathan J Sniadecki et al. Rev Sci Instrum. 2008 Apr.

Abstract

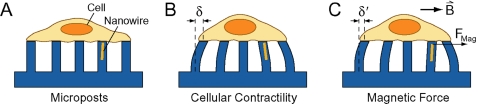
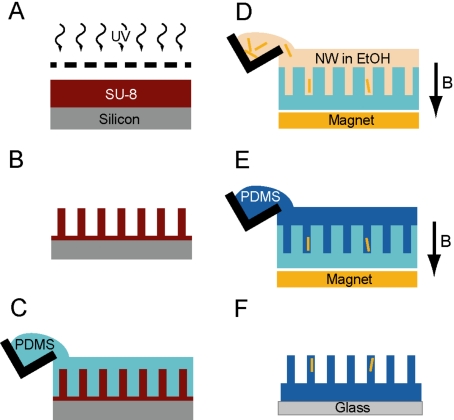
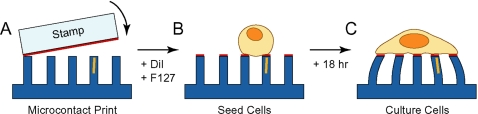
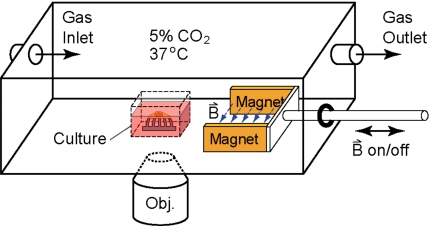
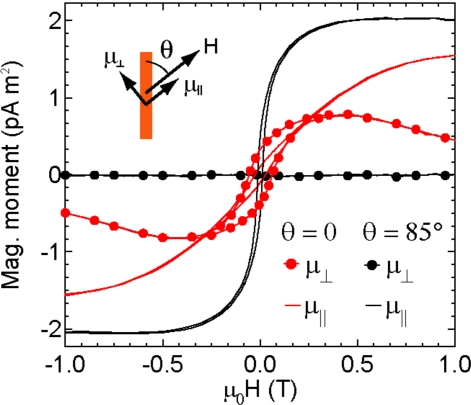
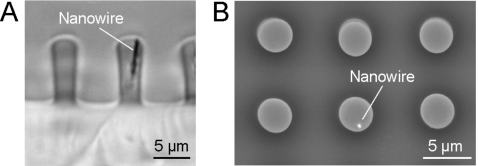
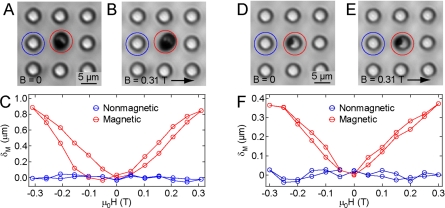
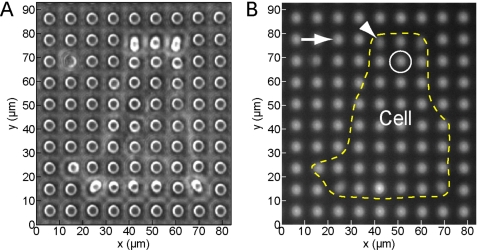
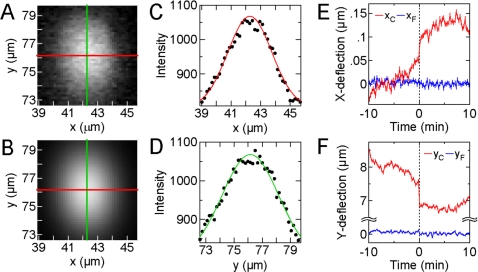
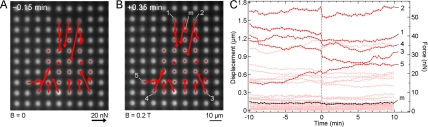
Cells use force as a mechanical signal to sense and respond to their microenvironment. Understanding how mechanical forces affect living cells requires the development of tool sets that can apply nanoscale forces and also measure cellular traction forces. However, there has been a lack of techniques that integrate actuation and sensing components to study force as a mechanical signal. Here, we describe a system that uses an array of elastomeric microposts to apply external forces to cells through cobalt nanowires embedded inside the microposts. We first biochemically treat the posts' surfaces to restrict cell adhesion to the posts' tips. Then by applying a uniform magnetic field (B<0.3 T), we induce magnetic torque on the nanowires that is transmitted to a cell's adhesion site as an external force. We have achieved external forces of up to 45 nN, which is in the upper range of current nanoscale force-probing techniques. Nonmagnetic microposts, similarly prepared but without nanowires, surround the magnetic microposts and are used to measure the traction forces and changes in cell mechanics. We record the magnitude and direction of the external force and the traction forces by optically measuring the deflection of the microposts, which linearly deflect as cantilever springs. With this approach, we can measure traction forces before and after force stimulation in order to monitor cellular response to forces. We present the fabrication methods, magnetic force characterization, and image analysis techniques used to achieve the measurements.


Figures

Figure 1
Figure 1
Illustration of the magnetic micropost array. (A) Cells are plated onto the micropost arrays that contain embedded cobalt nanowires. Microposts have 3 μm diameters, 10 μm heights, and 9 μm center-to-center spacing. Nanowires have 350 nm diameters and are 5–7 μm in length. (B) Traction forces from the cell impart deflections δ to the microposts. These deflections are measured to calculate the local traction force. (C) Application of a uniform magnetic field B induces a magnetic torque on the nanowire that causes an external force Fmag on the cell. Force stimulation causes a change in traction forces δ that can be readily detected.
Figure 2
Figure 2
Fabrication of magnetic micropost arrays. (A) SU-8 photoresist is spin coated onto a silicon wafer and exposed with 365 nm light through a photomask to pattern the SU-8. (B) Developing the resist results in freestanding SU-8 microposts. (C) Micropost arrays are cast in PDMS to create negative molds. (D) Nanowires suspended in ethanol are aliquoted into the negative molds while under a magnetic field B to draw the nanowires into the holes. (E) PDMS is poured into the template to encapsulate the nanowires. (F) The array is peeled from the template and contains both magnetic microposts with nanowires and nonmagnetic microposts.
Figure 3
Figure 3
(A) Preparation of the magnetic microposts starts with microcontact printing of fibronectin onto the microposts. A hydrophobic, fluorescent dye (DiI) impregnates the PDMS for fluorescent microscopy. Pluronics F127 NF (F127) is adsorbed to the PDMS to block cellular adhesion from the sidewalls and base. (B) Cells are plated on the microposts and allowed to spread on the fibronectin surface. (C) After culturing overnight (18 h), the cells are ready for testing.
Figure 4
Figure 4
Schematic of the setup for live-cell measurements. Cells on the micropost array are placed in a custom-built microscope chamber that has a sliding rail system with NdFeB magnets to apply a uniform horizontal magnetic field across the array. Temperature and CO2 levels are controlled to ensure viability of the cells. The arrays are placed inside a glass-bottom cubic culture dish with medium and video recorded on an inverted fluorescence microscope (not drawn to scale).
Figure 5
Figure 5
Measurement at room temperature of magnetic moment μ per cobalt nanowire vs magnetic field μ0H shows different magnetizations for applied field angle θ. Inset: Schematic of H oriented at angle θ to the long axis of the nanowire and magnetic moment components μ and μ in the parallel and perpendicular directions.
Figure 6
Figure 6
Microscopy imaging of embedded nanowires in the magnetic microposts. (A) Phase contrast image of a cross-sectioned array showing a nanowire embedded in the microposts. (B) Scanning electron micrograph of the array with the contrast of the cobalt nanowire enhanced with backscattering.
Figure 7
Figure 7
Characterization of magnetic micropost deflections. [(A) and (D)] Phase contrast image of magnetic microposts under zero field. [(B) and (E)] Applying a 0.31 T field causes deflection in the magnetic microposts. [(C) and (F)] Displacement δM vs applied field μ0H for magnetic and nonmagnetic microposts labeled in panels A and D.
Figure 8
Figure 8
(A) Phase contrast image of the micropost array with a NIH 3T3 cell attached. (B) Fluorescent image of the same micropost array. The cell outline is traced from the corresponding phase contrast image. The arrow indicates a nonmagnetic micropost nearby the cell. The arrowhead indicates a nonmagnetic micropost to which the cell is attached. The circle indicates the location of the magnetic micropost.
Figure 9
Figure 9
Image analysis for measuring the deflections of the microposts. (A) Image of a micropost [arrowhead in Fig. 8b] with an applied traction force by the cell. The center of the micropost is identified with an x-center line (red) and y-center line (green). (B) Two-dimensional Gaussian curve fit for the image data in panel B. (C) Gaussian fit data (red line) compared with image data (black dots) along the x-center line. (D) Gaussian fit data (green line) compared with image data (black dots) along the y-center line. [(E) and (F)] Plots of calculated x- and y-deflections vs time for the post in panel A (red, subscript “C”) and a free post (blue, subscript “F”) identified in Fig. 8b with an arrow. The field is turned on at t=0 and a force Fmag=3.33 nN is applied in the positive y-direction at the magnetic post. Error bars indicate uncertainty in image analysis.
Figure 10
Figure 10
Live-cell force microscopy results. [(A) and (B)] Red arrows show traction forces before (t=−0.15 min) and after (t=+0.35 min) application of external force calculated from fluorescent image of the array. Force stimulation at t=0 leads to nonlocal changes in the contractility of the cell. (C) Displacement and traction forces vs time for the cell posts (pink), a subset of cell posts labeled in panel B (red), and the magnetic micropost (black).

References

    1. Ingber D. E., Ann. Med. ZZZZZZ 35, 564 (2003). - PubMed
    1. Geiger B., Bershadsky A., Pankov R., and Yamada K. M., Nat. Rev. Mol. Cell Biol. ZZZZZZ 2, 793 (2001). - PubMed
    1. Alenghat F. J. and Ingber D. E., Science SCIEAS STKE 2002, PE6 (2002). - PubMed
    1. Choquet D., Felsenfeld D. P., and Sheetz M. P., Cell CELLB510.1016/S0092-8674(00)81856-5 88, 39 (1997). - DOI - PubMed
    1. Galbraith C. G., Yamada K. M., and Sheetz M. P., J. Cell Biol. JCLBA310.1083/jcb.200204153 159, 695 (2002). - DOI - PMC - PubMed

Publication types

MeSH terms