. 2008 Apr 29;6(4):e96.
doi: 10.1371/journal.pbio.0060096.

High-throughput SHAPE analysis reveals structures in HIV-1 genomic RNA strongly conserved across distinct biological states

Affiliations

High-throughput SHAPE analysis reveals structures in HIV-1 genomic RNA strongly conserved across distinct biological states

Kevin A Wilkinson et al. PLoS Biol. .

Abstract

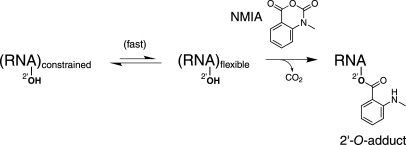
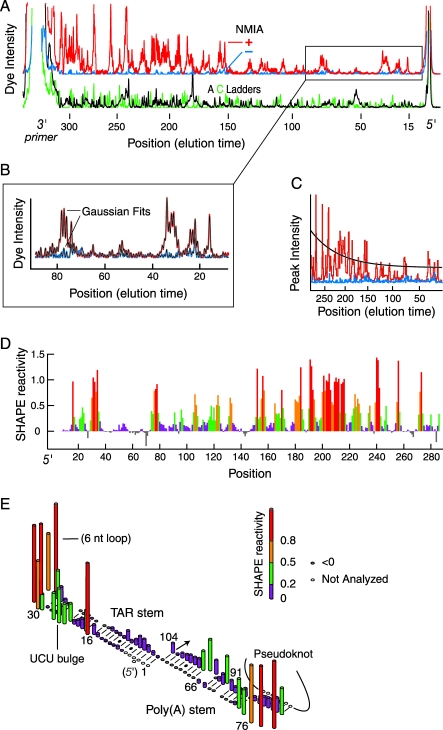
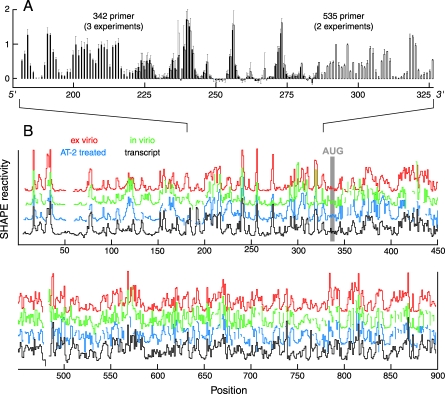
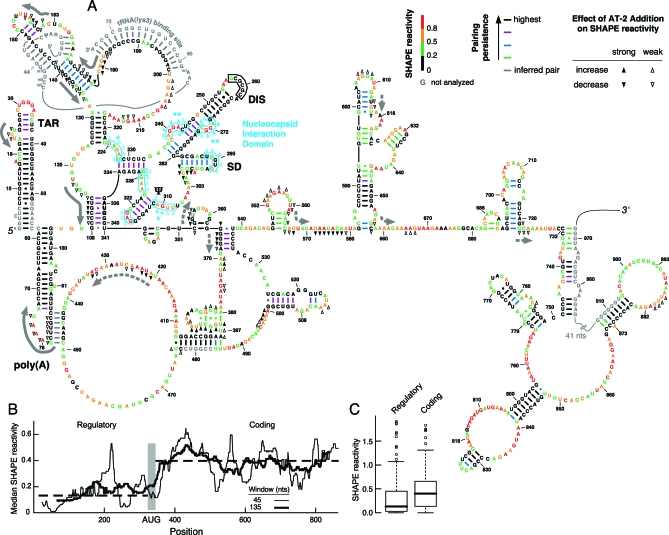
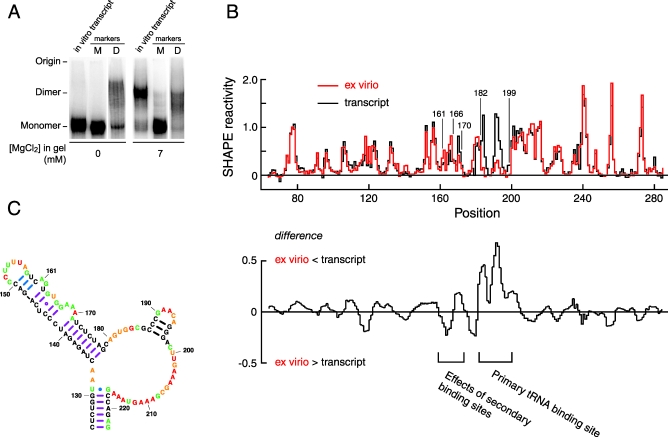
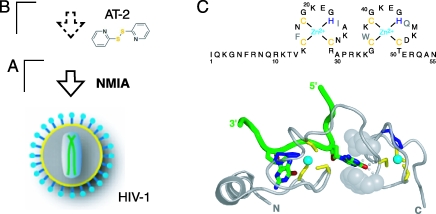
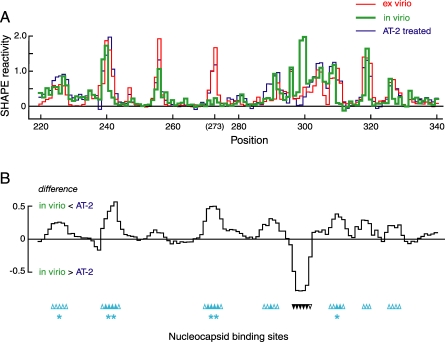
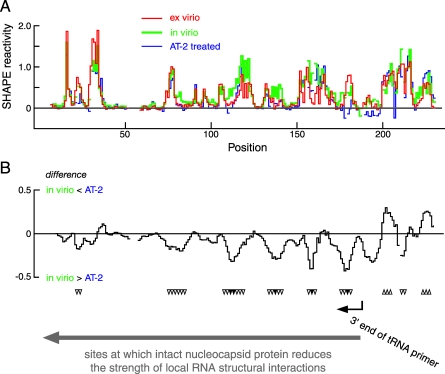
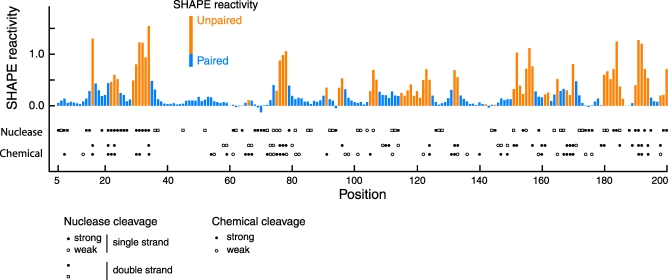
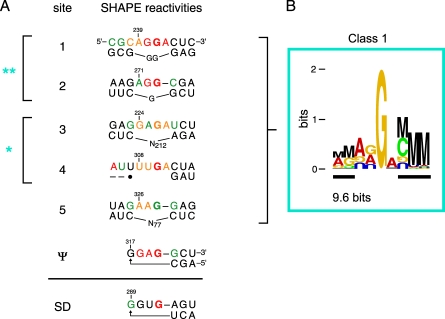
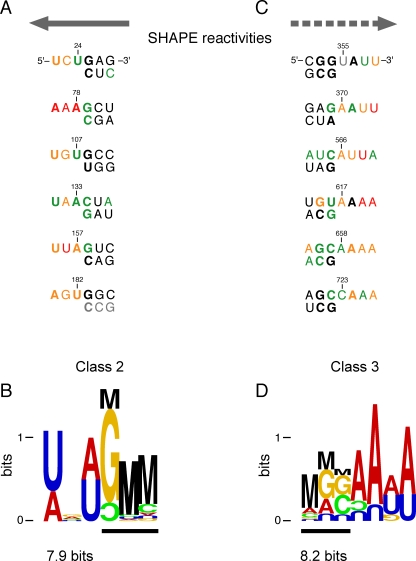
Replication and pathogenesis of the human immunodeficiency virus (HIV) is tightly linked to the structure of its RNA genome, but genome structure in infectious virions is poorly understood. We invent high-throughput SHAPE (selective 2'-hydroxyl acylation analyzed by primer extension) technology, which uses many of the same tools as DNA sequencing, to quantify RNA backbone flexibility at single-nucleotide resolution and from which robust structural information can be immediately derived. We analyze the structure of HIV-1 genomic RNA in four biologically instructive states, including the authentic viral genome inside native particles. Remarkably, given the large number of plausible local structures, the first 10% of the HIV-1 genome exists in a single, predominant conformation in all four states. We also discover that noncoding regions functioning in a regulatory role have significantly lower (p-value < 0.0001) SHAPE reactivities, and hence more structure, than do viral coding regions that function as the template for protein synthesis. By directly monitoring protein binding inside virions, we identify the RNA recognition motif for the viral nucleocapsid protein. Seven structurally homologous binding sites occur in a well-defined domain in the genome, consistent with a role in directing specific packaging of genomic RNA into nascent virions. In addition, we identify two distinct motifs that are targets for the duplex destabilizing activity of this same protein. The nucleocapsid protein destabilizes local HIV-1 RNA structure in ways likely to facilitate initial movement both of the retroviral reverse transcriptase from its tRNA primer and of the ribosome in coding regions. Each of the three nucleocapsid interaction motifs falls in a specific genome domain, indicating that local protein interactions can be organized by the long-range architecture of an RNA. High-throughput SHAPE reveals a comprehensive view of HIV-1 RNA genome structure, and further application of this technology will make possible newly informative analysis of any RNA in a cellular transcriptome.


Conflict of interest statement

Competing interests. KAW, SMV, NG, MCG and KMW have applied for a patent related to some of the technology described in this work.

Figures

Figure 1
Figure 1. Scheme for RNA SHAPE Chemistry
Figure 2
Figure 2. Analysis of HIV-1 RNA Genome Structure Using hSHAPE
(A) Intensity versus elution time for an hSHAPE analysis resolved by single capillary electrophoresis using the HIV-1 in vitro transcript. The (+) and (−) NMIA reactions (red and blue) are offset from the A and C sequencing lanes (black and green) for clarity. (B) Whole-trace peak integration of a section of data from part (A). (+) and (−) peaks were fit to Gaussian curves (thin black lines) and aligned to the sequencing channels. (C) Signal decay correction for the (+) NMIA trace assuming a constant probability for extension at each nucleotide (black line). (D) Processed SHAPE reactivities as a function of nucleotide position. Highly reactive nucleotides (red and orange bars) report flexible positions in the RNA. (E) Absolute SHAPE reactivities superimposed on a secondary structure model for the TAR and Poly(A) stem-loops.
Figure 3
Figure 3. Single Nucleotide Resolution hSHAPE RNA Structure Analysis Is Quantitative and Highly Reproducible
(A) SHAPE reactivities of two overlapping extension reactions for the in vitro transcript using primers that anneal approximately 200 nucleotides apart. Solid and open bars indicate normalized SHAPE reactivities for primers that anneal at nucleotides 342–362 and 535–555, respectively. Error bars represent standard deviations calculated from independent experiments using the same primer. (B) Complete SHAPE data for HIV-1 genomic RNA analyzed in virions and in the ex virio, AT-2–treated, and in vitro transcript states (see Dataset S1).
Figure 4
Figure 4. Architecture and Protein Modulation of the Structure of the HIV-1 NL4–3 RNA Genome
(A) Secondary structure model generated by SHAPE-constrained folding of the ex virio state. All four states fold to this structure. Nucleotides proposed to form intermolecular base pairs with a second monomer are enclosed within a black box; the AUG start codon for the Gag polyprotein (nucleotide 336) is boldface. Nucleotides are colored according to their SHAPE reactivity; bars indicating base pairing are colored by their pairing persistence. Effects of pretreatment of viral particles with AT-2 are indicated with closed and open arrowheads. Clustered sites that show a strong increase in reactivity with AT-2 treatment (and report specific nucleocapsid binding sites) are emphasized in cyan; proposed primary and secondary sites are identified with double (**) and single asterisks (*), respectively. Sites showing a strong reduction in SHAPE reactivity (and reporting the structure destabilizing activity of nucleocapsid) are emphasized with solid and dashed gray arrows. The bound tRNA(lys3) is shown starting at nucleotide 33. The pseudoknot involving positions 75–84/443–449 [14] was not predicted directly by our algorithm, but by inference because both loop regions were unreactive towards SHAPE chemistry. (B) The 5′ regulatory domain is more highly structured than the 3′ coding region. Median SHAPE reactivities (solid lines) were calculated over rolling windows of 45 and 135 nts. Median reactivities for the entire 5′ regulatory and 3′ coding regions (dashed lines) are 0.13 and 0.40, respectively. (C) Box plot analysis [64] of distinct reactivity distributions for the 5′ and 3′ domains. Boxes outline middle 50% of each dataset; medians are shown with heavy lines. Open circles indicate values >1.5 times the interquartile range (boxed) and are considered outliers. The fences (small horizontal lines above and below the box) are the largest or smallest non-outlier values.
Figure 5
Figure 5. RNA Conformational Changes That Differentiate Ex Virio and In Vitro Transcript States
(A) The in vitro transcript forms a loop-loop dimer. Identical samples of the transcript RNA were resolved in nondenaturing gels, either omitting or containing 7 mM MgCl2. Markers for monomeric (M) and dimeric (D) conformations are shown. (B) SHAPE reactivity as a function of nucleotide position for ex virio (red) and transcript (black) RNAs. Difference plot in lower panel has been smoothed over a 5-nt window. (C) Secondary structure model for the primer binding site in the absence of tRNA(lys3).
Figure 6
Figure 6. Analysis of the Effects of Nucleocapsid Binding on HIV-1 RNA Genome Structure by In Situ Disruption Using the Zinc-Ejecting Agent AT-2
(A and B) Schemes for analyzing HIV-1 genomic RNA structure in virio (A) and following zinc-ejection with AT-2 (B). (C) Amino acid sequence and an RNA-bound conformation [58] of the HIV-1 nucleocapsid protein. Nucleocapsid is gray, and the RNA strand is green. Bound Zn2+ is cyan; zinc ligands are yellow and blue. Conserved stacking interactions for the C-terminal zinc knuckle are shown by space-filling atoms; hydrogen bonds are shown as small spheres.
Figure 7
Figure 7. A Specific Nucleocapsid Binding Domain in the HIV-1 Genome
(A) SHAPE reactivities as a function of nucleotide position for ex virio (red), in virio (green), and AT-2-treated (blue) states. (B) Difference plot illustrating the effect of AT-2 treatment on SHAPE reactivity relative to in virio genomic RNA. Sites of enhanced SHAPE reactivity upon compromising nucleocapsid zinc knuckle structures by AT-2 treatment are reported as positive peaks. Individual nucleotides showing large changes in reactivity are indicated with upward-pointing arrowheads and correspond to the same symbols shown in Figure 4A. Primary and secondary sites are emphasized with double (**) and single asterisks (*) , respectively. Reactivity differences are smoothed over a 5-nt window.
Figure 8
Figure 8. Nucleocapsid Increases SHAPE Reactivity and, by Inference, RNA Flexibility at Multiple Sites 5′ to the tRNA(lys3) Primer Binding Site
(A) Absolute SHAPE reactivities for the ex virio (red), in virio (green) and AT-2 treated (blue) states. (B) Difference plot reporting the effect of AT-2 treatment on the in virio state. Position of bound 3′ end of the tRNA primer is shown with a black arrow; large gray arrow and downward-pointing arrowheads indicate sites of structure destabilization by nucleocapsid.
Figure 9
Figure 9. Density of SHAPE Reactivity Information Compared with Analyses of Related HIV-1 Sequences Using Conventional Chemical and Enzymatic Probes
The histogram illustrates SHAPE reactivity as a function of position for the in vitro transcript RNA. Bars are colored according to whether the nucleotide is predicted to be paired (blue) or single stranded (orange). The results of nuclease mapping [15] (HXB2 isolate) and chemical mapping studies [8,16] (top, HXB2; bottom, MAL) are indicated below the SHAPE histogram. All mapping data were aligned with the HIV-1 NL4–3 sequence. This plot shows the most information-dense genome regions as analyzed by conventional approaches; significantly less information was available 3′ of position 360, and none was available 3′ of position 720 in the first 10% of the HIV-1 genome.
Figure 10
Figure 10. Nucleocapsid Binding Sites in the 5′ Regulatory Domain and Their Sequence and Structural Consensus
Sites shown all exhibit statistically significant (p < 0.001) increases in SHAPE reactivity upon compromising RNA-nucleocapsid interactions by AT-2 treatment. (A) Alignment of internal loop (sites 1–5) and stem-loop (Ψ and SD) nucleocapsid binding sites (from Figure 4A). Nucleotides are colored by their SHAPE reactivity: red and orange indicate highly reactive positions; black nucleotides are unreactive. Primary and secondary sites are emphasized with double (**) and single (*) asterisks. N indicates the number of intervening nucleotides on the lower strand. (B) Information content for sites 1–5. Duplex regions are identified by black bars. Height of each letter indicates information. M represents mutual information from base pairing [54,55]; each nucleotide is color coded by base identity. For clarity, only the top strand is shown.
Figure 11
Figure 11. Alignment and Information Content at Sites where AT-2 Treatment Decreases SHAPE Reactivity
(A) Alignment and (B) information content of the six Class 2 sites in the 5′ regulatory domain (gray arrow as in Figure 4A). Symbols are described in Figure 10. (C) Alignment and (D) information content of six Class 3 sites in the 3′ coding region (dashed arrow as in Figure 4A).

References

    1. Coffin JM, Hughes SH, Varmus HE. Retroviruses. Cold Spring Harbor (New York): Cold Spring Harbor Press; 1997. 843 - PubMed
    1. Frankel AD, Young JAT. HIV-1: fifteen proteins and an RNA. Annu Rev Biochem. 1998;67:1–25. - PubMed
    1. Berkowitz R, Fisher J, Goff SP. RNA packaging. Curr Top Microbiol Immunol. 1996;214:177–218. - PubMed
    1. Rein A. Take two. Nature Struct Mol Biol. 2004;11:1034–1035. - PubMed
    1. D'Souza V, Summers MF. How retroviruses select their genomes. Nat Rev Microbiol. 2005;3:643–655. - PubMed

Publication types

MeSH terms

Associated data