

Comparative analysis of sequence features involved in the recognition of tandem splice sites
- PMID: 18447903
- PMCID: PMC2423196
- DOI: 10.1186/1471-2164-9-202
Comparative analysis of sequence features involved in the recognition of tandem splice sites
Abstract
Background: The splicing of pre-mRNAs is conspicuously often variable and produces multiple alternatively spliced (AS) isoforms that encode different messages from one gene locus. Computational studies uncovered a class of highly similar isoforms, which were related to tandem 5'-splice sites (5'ss) and 3'-splice sites (3'ss), yet with very sparse anecdotal evidence in experimental studies. To compare the types and levels of alternative tandem splice site exons occurring in different human organ systems and cell types, and to study known sequence features involved in the recognition and distinction of neighboring splice sites, we performed large-scale, stringent alignments of cDNA sequences and ESTs to the human and mouse genomes, followed by experimental validation.
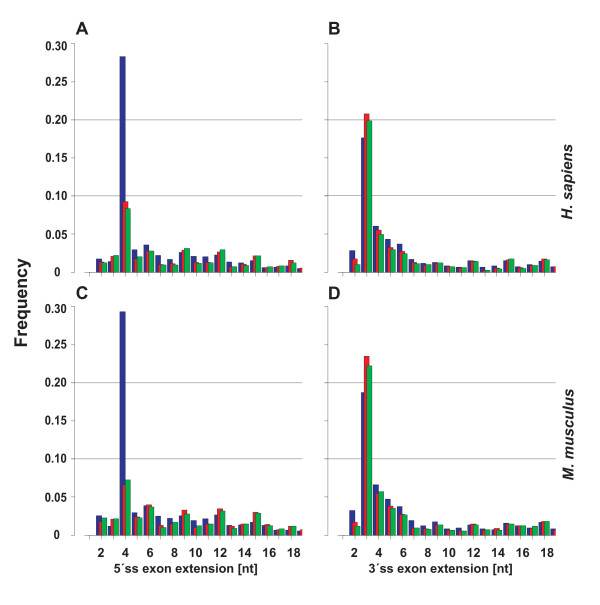
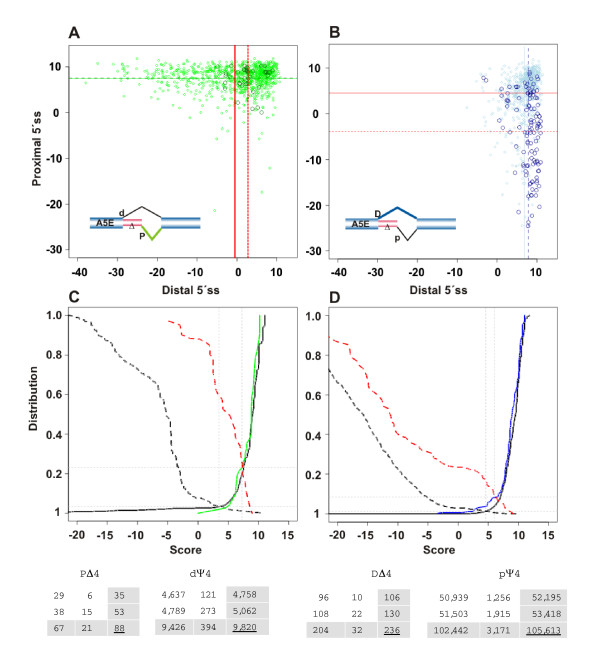
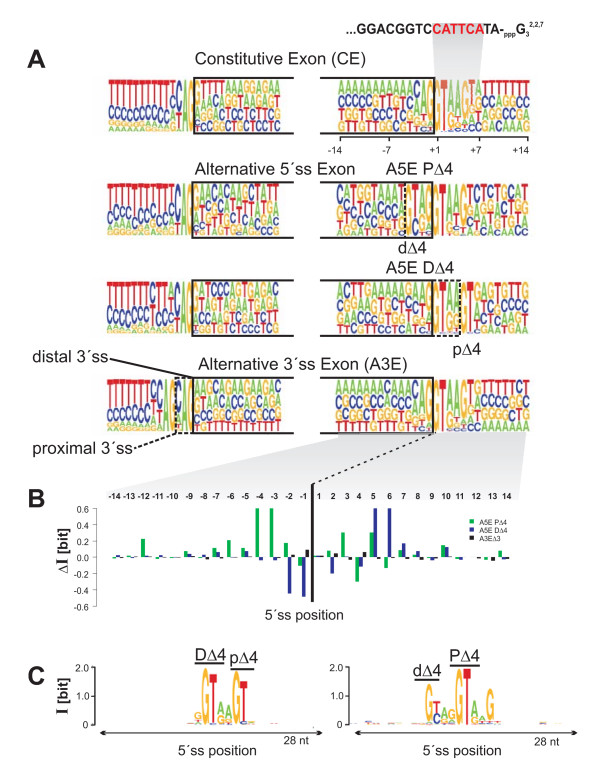
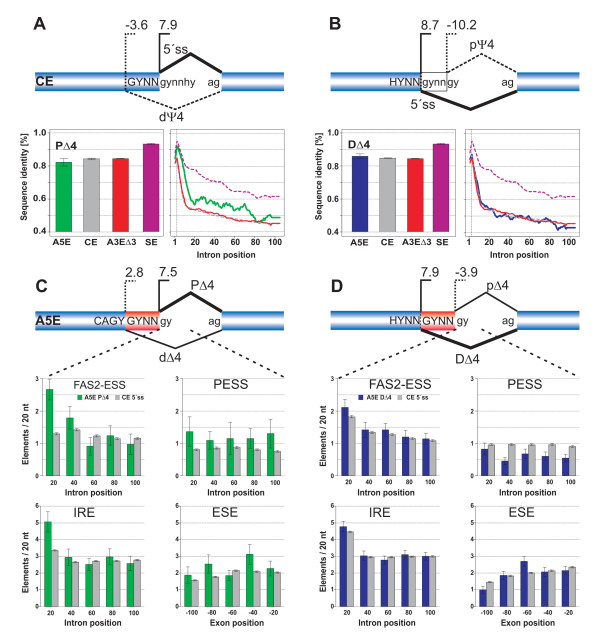
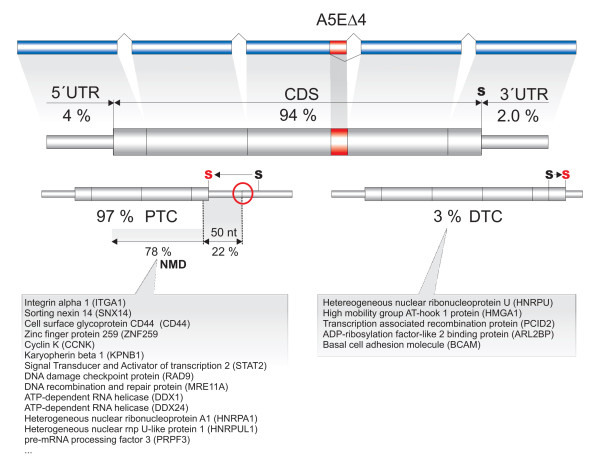
Results: We analyzed alternative 5'ss exons (A5Es) and alternative 3'ss exons (A3Es), derived from transcript sequences that were aligned to assembled genome sequences to infer patterns of AS occurring in several thousands of genes. Comparing the levels of overlapping (tandem) and non-overlapping (competitive) A5Es and A3Es, a clear preference of isoforms was seen for tandem acceptors and donors, with four nucleotides and three to six nucleotides long exon extensions, respectively. A subset of inferred A5E tandem exons was selected and experimentally validated. With the focus on A5Es, we investigated their transcript coverage, sequence conservation and base-paring to U1 snRNA, proximal and distal splice site classification, candidate motifs for cis-regulatory activity, and compared A5Es with A3Es, constitutive and pseudo-exons, in H. sapiens and M. musculus. The results reveal a small but authentic enriched set of tandem splice site preference, with specific distances between proximal and distal 5'ss (3'ss), which showed a marked dichotomy between the levels of in- and out-of-frame splicing for A5Es and A3Es, respectively, identified a number of candidate NMD targets, and allowed a rough estimation of a number of undetected tandem donors based on splice site information.
Conclusion: This comparative study distinguishes tandem 5'ss and 3'ss, with three to six nucleotides long extensions, as having unusually high proportions of AS, experimentally validates tandem donors in a panel of different human tissues, highlights the dichotomy in the types of AS occurring at tandem splice sites, and elucidates that human alternative exons spliced at overlapping 5'ss posses features of typical splice variants that could well be beneficial for the cell.
Figures
Similar articles
-
A suboptimal 5' splice site downstream of HIV-1 splice site A1 is required for unspliced viral mRNA accumulation and efficient virus replication.Retrovirology. 2006 Feb 3;3:10. doi: 10.1186/1742-4690-3-10. Retrovirology. 2006. PMID: 16457729 Free PMC article.
-
Negative and positive mRNA splicing elements act competitively to regulate human immunodeficiency virus type 1 vif gene expression.J Virol. 2008 Apr;82(8):3921-31. doi: 10.1128/JVI.01558-07. Epub 2008 Feb 13. J Virol. 2008. PMID: 18272582 Free PMC article.
-
Impact of acceptor splice site NAGTAG motif on exon recognition.Mol Biol Rep. 2019 Jun;46(3):2877-2884. doi: 10.1007/s11033-019-04734-6. Epub 2019 Mar 6. Mol Biol Rep. 2019. PMID: 30840204
-
A novel role of U1 snRNP: Splice site selection from a distance.Biochim Biophys Acta Gene Regul Mech. 2019 Jun;1862(6):634-642. doi: 10.1016/j.bbagrm.2019.04.004. Epub 2019 Apr 28. Biochim Biophys Acta Gene Regul Mech. 2019. PMID: 31042550 Free PMC article. Review.
-
Pick one, but be quick: 5' splice sites and the problems of too many choices.Genes Dev. 2013 Jan 15;27(2):129-44. doi: 10.1101/gad.209759.112. Genes Dev. 2013. PMID: 23348838 Free PMC article. Review.
Cited by
-
Restriction digest screening facilitates efficient detection of site-directed mutations introduced by CRISPR in C. albicans UME6.PeerJ. 2018 Jun 6;6:e4920. doi: 10.7717/peerj.4920. eCollection 2018. PeerJ. 2018. PMID: 29892505 Free PMC article.
-
Palmitate- and C6 ceramide-induced Tnnt3 pre-mRNA alternative splicing occurs in a PP2A dependent manner.Nutr Metab (Lond). 2018 Dec 17;15:87. doi: 10.1186/s12986-018-0326-3. eCollection 2018. Nutr Metab (Lond). 2018. PMID: 30564278 Free PMC article.
-
Coding exon-structure aware realigner (CESAR) utilizes genome alignments for accurate comparative gene annotation.Nucleic Acids Res. 2016 Jun 20;44(11):e103. doi: 10.1093/nar/gkw210. Epub 2016 Mar 25. Nucleic Acids Res. 2016. PMID: 27016733 Free PMC article.
-
Ratios of Four STAT3 Splice Variants in Human Eosinophils and Diffuse Large B Cell Lymphoma Cells.PLoS One. 2015 May 18;10(5):e0127243. doi: 10.1371/journal.pone.0127243. eCollection 2015. PLoS One. 2015. PMID: 25984943 Free PMC article.
-
Phosphatidylinositol 4-phosphate 5-kinase Iγ_v6, a new splice variant found in rodents and humans.Biochem Biophys Res Commun. 2011 Jul 29;411(2):416-20. doi: 10.1016/j.bbrc.2011.06.168. Epub 2011 Jul 2. Biochem Biophys Res Commun. 2011. PMID: 21756881 Free PMC article.
References
-
- Berget SM. Exon recognition in vertebrate splicing. J Biol Chem. 1995;270:2411–-2414. - PubMed
Publication types
MeSH terms
Substances
LinkOut - more resources
Full Text Sources
Research Materials
