Comparative Study
. 2008 Apr 30:8:122.
doi: 10.1186/1471-2407-8-122.

Growth of human gastric cancer cells in nude mice is delayed by a ketogenic diet supplemented with omega-3 fatty acids and medium-chain triglycerides

Affiliations
Comparative Study

Growth of human gastric cancer cells in nude mice is delayed by a ketogenic diet supplemented with omega-3 fatty acids and medium-chain triglycerides

Christoph Otto et al. BMC Cancer. .

Abstract

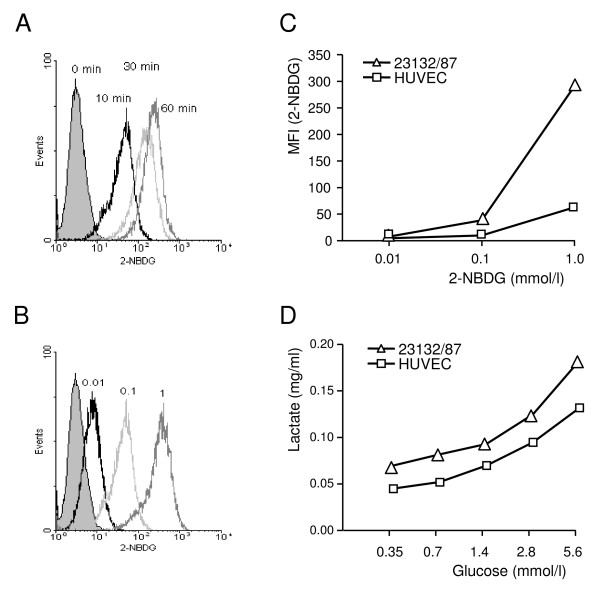
Background: Among the most prominent metabolic alterations in cancer cells are the increase in glucose consumption and the conversion of glucose to lactic acid via the reduction of pyruvate even in the presence of oxygen. This phenomenon, known as aerobic glycolysis or the Warburg effect, may provide a rationale for therapeutic strategies that inhibit tumour growth by administration of a ketogenic diet with average protein but low in carbohydrates and high in fat enriched with omega-3 fatty acids and medium-chain triglycerides (MCT).

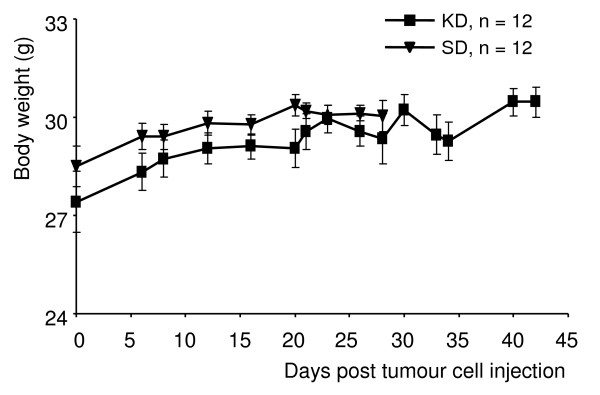
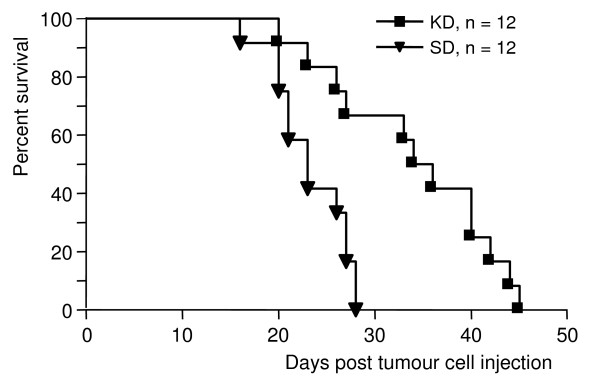
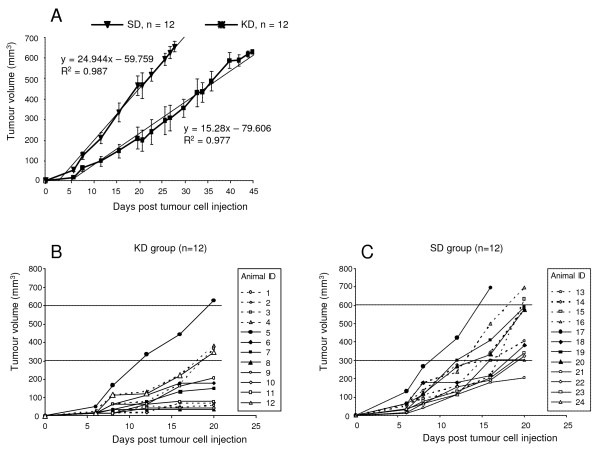
Methods: Twenty-four female NMRI nude mice were injected subcutaneously with tumour cells of the gastric adenocarcinoma cell line 23132/87. The animals were then randomly split into two feeding groups and fed either a ketogenic diet (KD group; n = 12) or a standard diet (SD group; n = 12) ad libitum. Experiments were ended upon attainment of the target tumor volume of 600 mm3 to 700 mm3. The two diets were compared based on tumour growth and survival time (interval between tumour cell injection and attainment of target tumour volume).

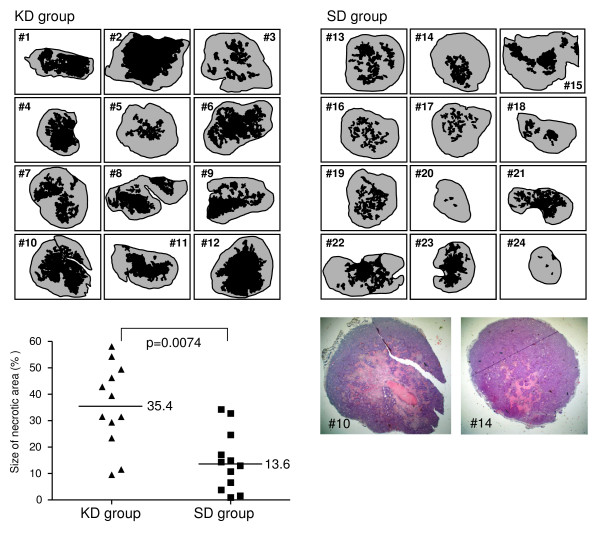
Results: The ketogenic diet was well accepted by the KD mice. The tumour growth in the KD group was significantly delayed compared to that in the SD group. Tumours in the KD group reached the target tumour volume at 34.2 +/- 8.5 days versus only 23.3 +/- 3.9 days in the SD group. After day 20, tumours in the KD group grew faster although the differences in mean tumour growth continued significantly. Importantly, they revealed significantly larger necrotic areas than tumours of the SD group and the areas with vital tumour cells appear to have had fewer vessels than tumours of the SD group. Viable tumour cells in the border zone surrounding the necrotic areas of tumours of both groups exhibited a glycolytic phenotype with expression of glucose transporter-1 and transketolase-like 1 enzyme.

Conclusion: Application of an unrestricted ketogenic diet enriched with omega-3 fatty acids and MCT delayed tumour growth in a mouse xenograft model. Further studies are needed to address the impact of this diet on other tumour-relevant functions such as invasive growth and metastasis.


Figures

Figure 1
Figure 1
Glucose consumption and lactate production by tumour cells of the gastric carcinoma cell line 23132/87. (A) Time-dependent glucose uptake. The glucose uptake was measured with the fluorescent deoxyglucose analog 2-NBDG by flow cytometry. Tumour cells were incubated with 0.1 mmol/l 2-NBDG for 10, 30, and 60 min under normoxic conditions. The non-filled curves indicate the proportion of cells incorporating 2-NBDG and the filled curve represents the background staining of cells incubated with 2-NBDG on ice. (B) Concentration-dependent glucose uptake. Tumour cells were incubated with 0.01, 0.1, and 1 mmol/l 2-NBDG for 10 min. The filled curve represents cells incubated without 2-NBDG. (C) The 2-NBDG uptake of gastric carcinoma cells in comparison with HUVEC. The cells were incubated for 10 min with 0.01, 0.1, and 1 mmol/l, respectively. The flow cytometric data represents the total tumour cell population minus dead cells. MFI: Mean fluorescence intensity; ΔMFI = (MFI2-NBDG)-(MFIunstained cells). (D) Lactate production. Lactate concentration in the culture medium was measured as described in Methods. Lactate production by tumour cells and HUVEC depends on glucose concentration in the culture medium but shows an increase in gastric cancer cells. Data in A-D are from one of three independent experiments.
Figure 2
Figure 2
Changes in the body weight of tumour-bearing nude mice on the ketogenic and standard diets (n = 12 mice per group). Following tumour cell injection on day 0, animals of the KD group were fed the unrestricted ketogenic diet, animals of the SD group continued with the standard diet. Values are expressed as mean ± standard deviation. The slopes of the mean body weights of KD and SD animals are not significantly different (P = 0.065).
Figure 3
Figure 3
Influence of the ketogenic diet on animal survival times. Data are expressed as Kaplan-Meier survival curves (n = 12 mice per group). Survival in the KD group was significantly prolonged compared to that in the SD group (P = 0.001).
Figure 4
Figure 4
Influence of the ketogenic diet on tumour growth. (A) Shown is the mean tumour volume ± standard deviation as well as the respective regression lines of KD and SD animals. Endpoint for the experiments was attainment of a tumour volume between 600 and 700 mm3. Slopes are significantly different (P = 0.021). R2 (coefficient of determination). (B-C) Shown are tumour volumes for the individual animals of the KD and SD groups for the first 20 days after tumour cell inoculation.
Figure 5
Figure 5
Size of the necrotic areas (in black) in tumours of animals of the KD (animals 1–12) and SD (animals 13–24) groups. The total area of necrosis per section was quantified and expressed as the percentage to the total area of the section as described in Methods. Tumours of the KD group had significantly larger areas of necrosis than tumours of the SD group (P = 0.0074). A representative H&E histology for KD and SD animals is shown.

Similar articles

Cited by

References

    1. Hanahan D, Weinberg RA. The hallmarks of cancer. Cell. 2000;100:57–70. doi: 10.1016/S0092-8674(00)81683-9. - DOI - PubMed
    1. Ramanathan A, Wang C, Schreiber SL. Perturbational profiling of a cell-line model of tumorigenesis by using metabolic measurements. Proc Natl Acad Sci USA. 2005;102:5992–5997. doi: 10.1073/pnas.0502267102. - DOI - PMC - PubMed
    1. Pelicano H, Martin DS, Xu RH, Huang P. Glycolysis inhibition for anticancer treatment. Oncogene. 2006;25:4633–4646. doi: 10.1038/sj.onc.1209597. - DOI - PubMed
    1. Wittig R, Coy JF. The Role of Glucose Metabolism and Glucose-Associated Signalling in Cancer. Perspectives in Medicinal Chemistry. 2007;1:64–82. http://la-press.com/cr_data/files/f_PMC-1-Coy-et-al_490.pdf - PMC - PubMed
    1. Elstrom RL, Bauer DE, Buzzai M, Karnauskas R, Harris MH, Plas DR, Zhuang H, Cinalli RM, Alavi A, Rudin CM, Thompson CB. Akt stimulates aerobic glycolysis in cancer cells. Cancer Res. 2004;64:3892–3899. doi: 10.1158/0008-5472.CAN-03-2904. - DOI - PubMed

Publication types

MeSH terms