

Cross-scale sensitivity analysis of a non-small cell lung cancer model: linking molecular signaling properties to cellular behavior
- PMID: 18448237
- PMCID: PMC2430419
- DOI: 10.1016/j.biosystems.2008.03.002
Cross-scale sensitivity analysis of a non-small cell lung cancer model: linking molecular signaling properties to cellular behavior
Abstract
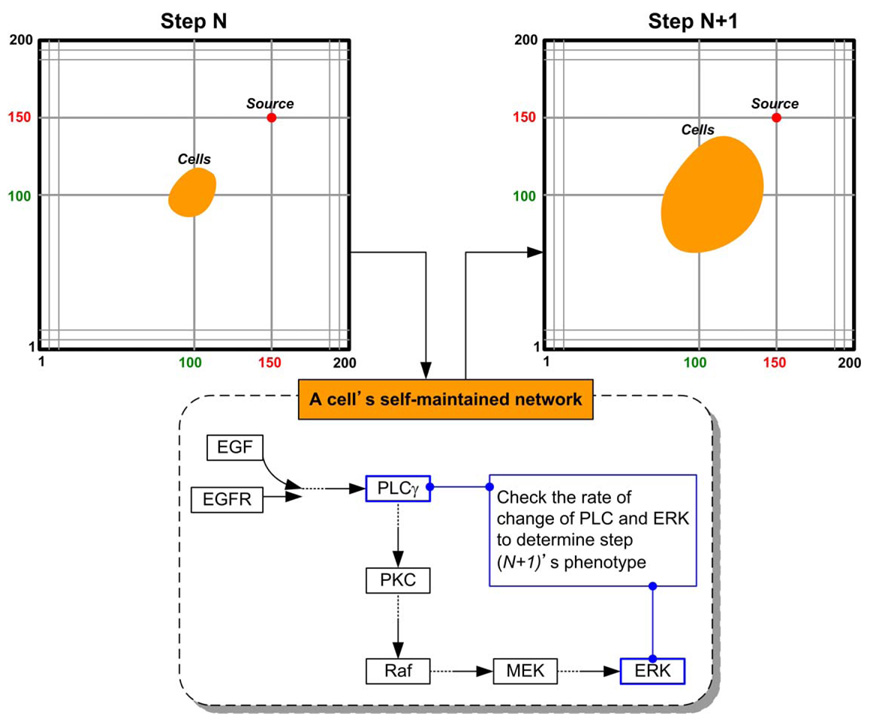
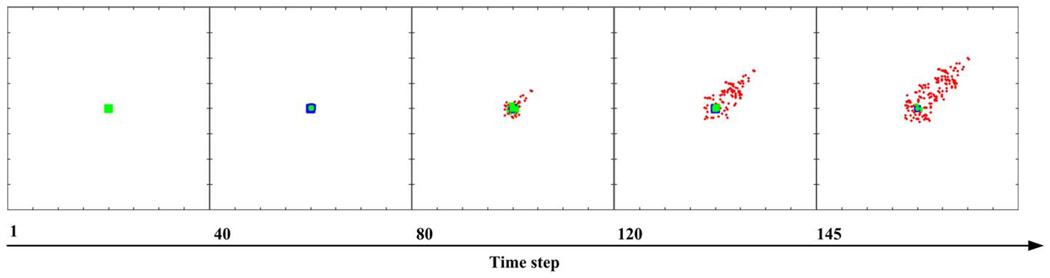
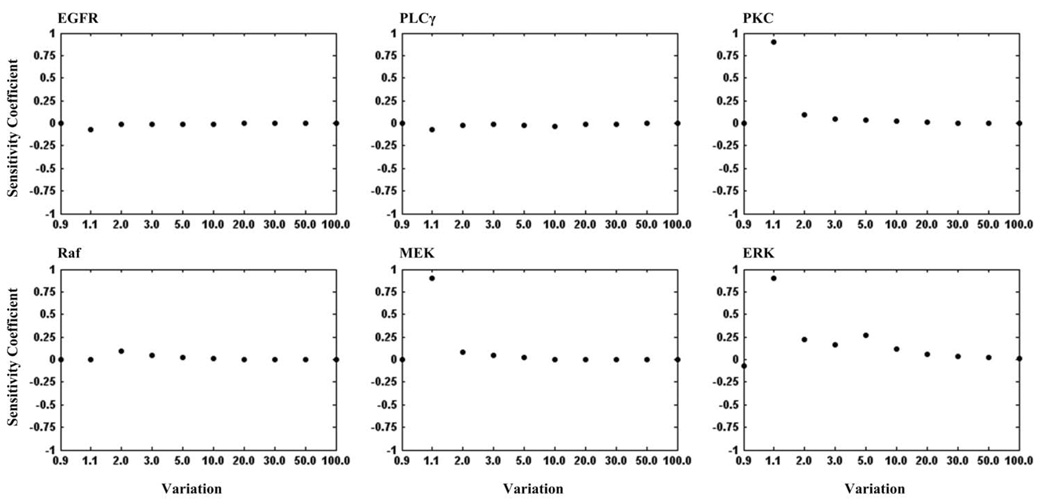
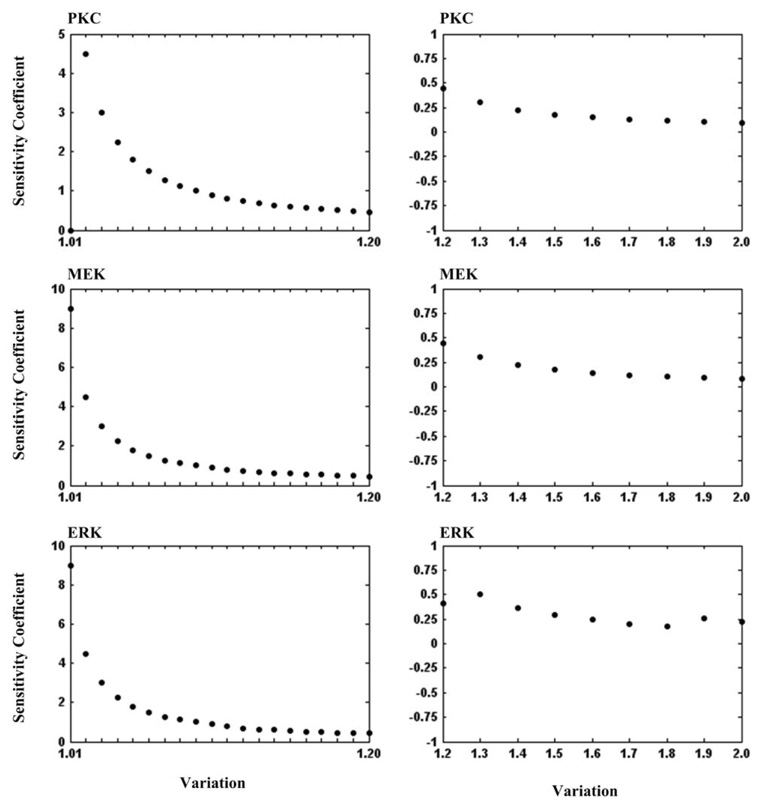
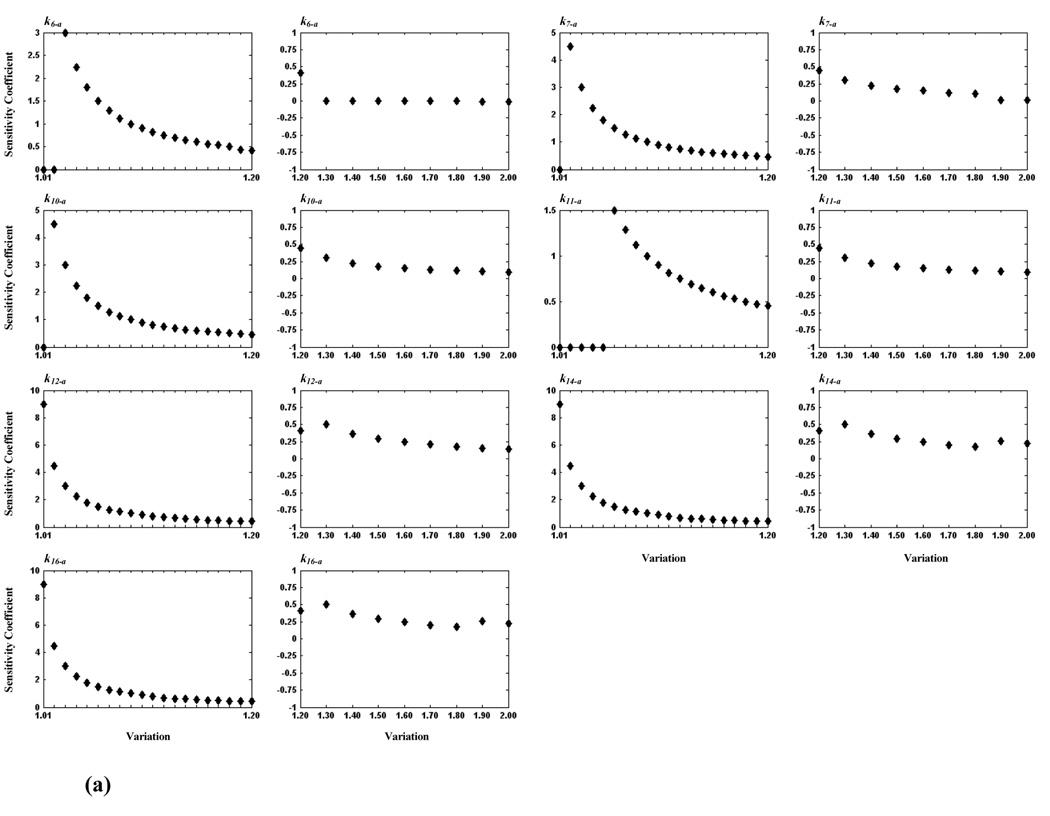
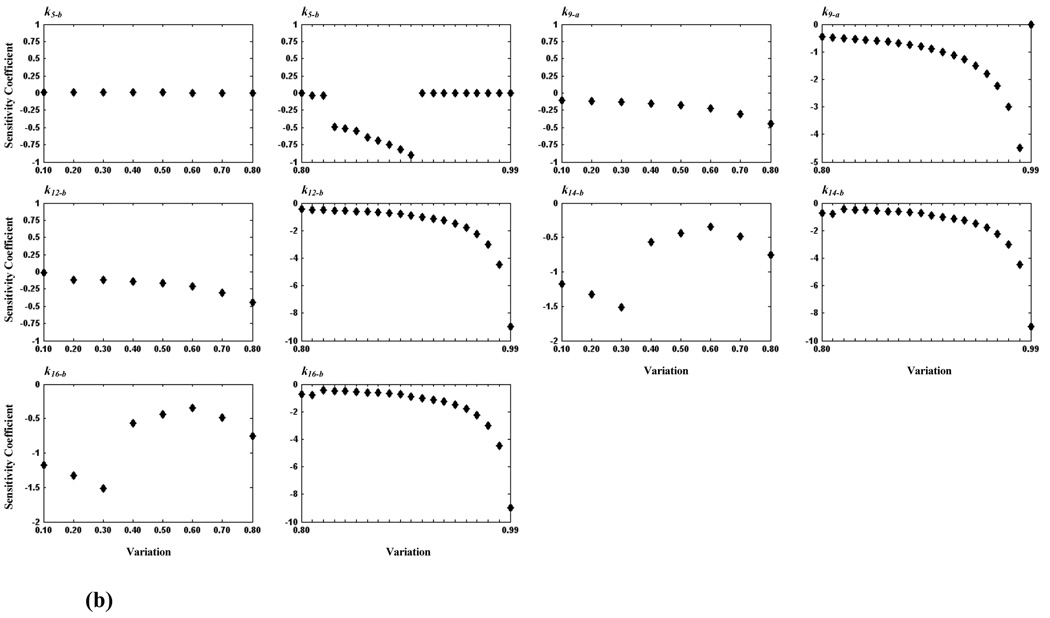
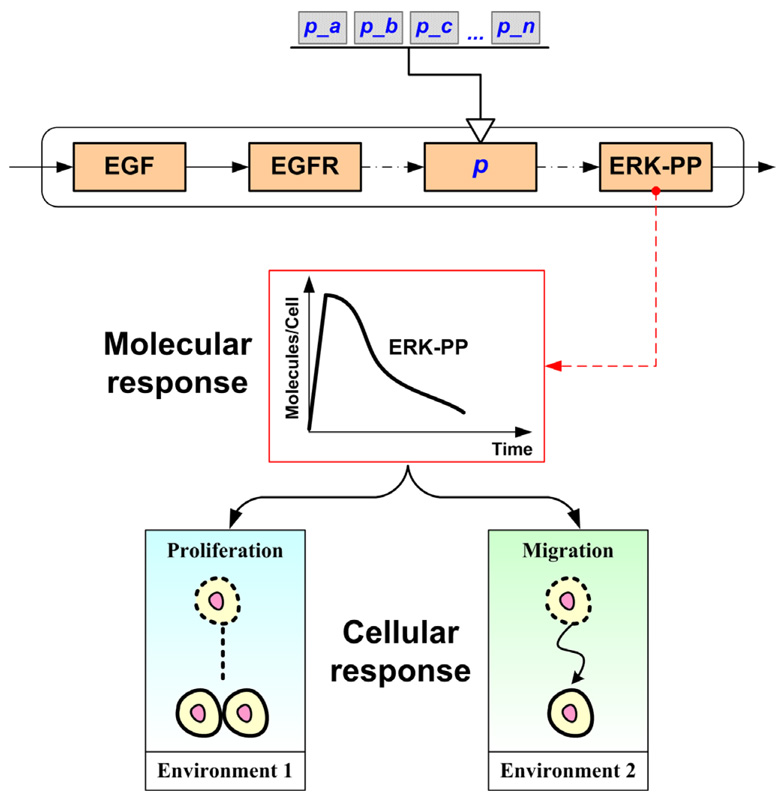
Sensitivity analysis is an effective tool for systematically identifying specific perturbations in parameters that have significant effects on the behavior of a given biosystem, at the scale investigated. In this work, using a two-dimensional, multiscale non-small cell lung cancer (NSCLC) model, we examine the effects of perturbations in system parameters which span both molecular and cellular levels, i.e. across scales of interest. This is achieved by first linking molecular and cellular activities and then assessing the influence of parameters at the molecular level on the tumor's spatio-temporal expansion rate, which serves as the output behavior at the cellular level. Overall, the algorithm operated reliably over relatively large variations of most parameters, hence confirming the robustness of the model. However, three pathway components (proteins PKC, MEK, and ERK) and eleven reaction steps were determined to be of critical importance by employing a sensitivity coefficient as an evaluation index. Each of these sensitive parameters exhibited a similar changing pattern in that a relatively larger increase or decrease in its value resulted in a lesser influence on the system's cellular performance. This study provides a novel cross-scaled approach to analyzing sensitivities of computational model parameters and proposes its application to interdisciplinary biomarker studies.
Figures
Similar articles
-
Mig-6 overcomes gefitinib resistance by inhibiting EGFR/ERK pathway in non-small cell lung cancer cell lines.Int J Clin Exp Pathol. 2014 Sep 15;7(10):7304-11. eCollection 2014. Int J Clin Exp Pathol. 2014. PMID: 25400829 Free PMC article.
-
Antitumor activity of histone deacetylase inhibitors in non-small cell lung cancer cells: development of a molecular predictive model.Mol Cancer Ther. 2008 Jul;7(7):1923-30. doi: 10.1158/1535-7163.MCT-07-2140. Epub 2008 Jul 7. Mol Cancer Ther. 2008. PMID: 18606719
-
Inhibition of FASN suppresses the malignant biological behavior of non-small cell lung cancer cells via deregulating glucose metabolism and AKT/ERK pathway.Lipids Health Dis. 2019 May 24;18(1):118. doi: 10.1186/s12944-019-1058-8. Lipids Health Dis. 2019. PMID: 31122252 Free PMC article.
-
Folic acid supplementation and malaria susceptibility and severity among people taking antifolate antimalarial drugs in endemic areas.Cochrane Database Syst Rev. 2022 Feb 1;2(2022):CD014217. doi: 10.1002/14651858.CD014217. Cochrane Database Syst Rev. 2022. PMID: 36321557 Free PMC article.
-
[Research progress of HGF/MET signaling pathway in EGFR-TKI resistance in non-small cell lung cancer].Zhongguo Fei Ai Za Zhi. 2014 Oct 20;17(10):755-9. doi: 10.3779/j.issn.1009-3419.2014.10.08. Zhongguo Fei Ai Za Zhi. 2014. PMID: 25342043 Free PMC article. Review. Chinese.
Cited by
-
Dealing with diversity in computational cancer modeling.Cancer Inform. 2013 May 7;12:115-24. doi: 10.4137/CIN.S11583. Print 2013. Cancer Inform. 2013. PMID: 23700360 Free PMC article.
-
Identification of Critical Molecular Components in a Multiscale Cancer Model Based on the Integration of Monte Carlo, Resampling, and ANOVA.Front Physiol. 2011 Jul 5;2:35. doi: 10.3389/fphys.2011.00035. eCollection 2011. Front Physiol. 2011. PMID: 21779251 Free PMC article.
-
The road to ERK activation: Do neurons take alternate routes?Cell Signal. 2020 Apr;68:109541. doi: 10.1016/j.cellsig.2020.109541. Epub 2020 Jan 13. Cell Signal. 2020. PMID: 31945453 Free PMC article. Review.
-
Dynamic Targeting in Cancer Treatment.Front Physiol. 2019 Feb 14;10:96. doi: 10.3389/fphys.2019.00096. eCollection 2019. Front Physiol. 2019. PMID: 30890944 Free PMC article.
-
Personalizing medicine: a systems biology perspective.Mol Syst Biol. 2009;5:249. doi: 10.1038/msb.2009.8. Epub 2009 Mar 17. Mol Syst Biol. 2009. PMID: 19293829 Free PMC article. No abstract available.
References
-
- Akhurst RJ, Derynck R. TGF-beta signaling in cancer--a double-edged sword. Trends Cell Biol. 2001;11(11):S44–S51. - PubMed
-
- Aldridge BB, Burke JM, Lauffenburger DA, Sorger PK. Physicochemical modelling of cell signalling pathways. Nat Cell Biol. 2006;8(11):1195–1203. - PubMed
-
- Allen LF, Sebolt-Leopold J, Meyer MB. CI-1040 (PD184352), a targeted signal transduction inhibitor of MEK (MAPKK) Semin Oncol. 2003;30(5 Suppl 16):105–116. - PubMed
-
- Bae KM, Wang H, Jiang G, Chen MG, Lu L, Xiao L. Protein kinase C epsilon is overexpressed in primary human non-small cell lung cancers and functionally required for proliferation of non-small cell lung cancer cells in a p21/Cip1-dependent manner. Cancer Res. 2007;67(13):6053–6063. - PubMed
Publication types
MeSH terms
Grants and funding
LinkOut - more resources
Full Text Sources
Medical
Miscellaneous
