. 2008 Jun 27;283(26):17979-90.
doi: 10.1074/jbc.M801053200. Epub 2008 Apr 29.

Identification of a new motif required for the 3'-5' exonuclease activity of Escherichia coli DNA polymerase I (Klenow fragment): the RRRY motif is necessary for the binding of single-stranded DNA substrate and the template strand of the mismatched duplex

Affiliations

Identification of a new motif required for the 3'-5' exonuclease activity of Escherichia coli DNA polymerase I (Klenow fragment): the RRRY motif is necessary for the binding of single-stranded DNA substrate and the template strand of the mismatched duplex

Pinky Kukreti et al. J Biol Chem. .

Abstract

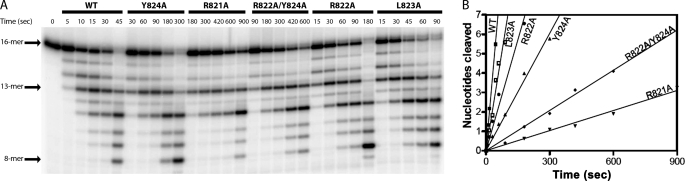
The Klenow fragment of Escherichia coli DNA polymerase I houses catalytic centers for both polymerase and 3'-5' exonuclease activities that are separated by about 35 A. Upon the incorporation of a mismatched nucleotide, the primer terminus is transferred from the polymerase site to an exonuclease site designed for excision of the mismatched nucleotides. The structural comparison of the binary complexes of DNA polymerases in the polymerase and the exonuclease modes, together with a molecular modeling of the template strand overhang in Klenow fragment, indicated its binding in the region spanning residues 821-824. Since these residues are conserved in the "A" family DNA polymerases, we have designated this region as the RRRY motif. The alanine substitution of individual amino acid residues of this motif did not change the polymerase activity; however, the 3'-5' exonuclease activity was reduced 2-29-fold, depending upon the site of mutation. The R821A and R822A/Y824A mutant enzymes showed maximum cleavage defect with single-stranded DNA, mainly due to a large decrease in the ssDNA binding affinity of these enzymes. Mismatch removal by these enzymes was only moderately affected. However, data from the exonuclease-polymerase balance assays with mismatched template-primer suggest that the mutant enzymes are defective in switching mismatched primer from the polymerase to the exonuclease site. Thus, the RRRY motif provides a binding track for substrate ssDNA and for nonsubstrate single-stranded template overhang, in a polarity-dependent manner. This binding then facilitates cleavage of the substrate at the exonuclease site.


Figures

FIGURE 1.
FIGURE 1.
Modeling the interactions of template overhang with Klenow fragment in exonuclease mode. A and B show the superimposition of the polymerase mode complex of KlenTaq (Protein Data Bank file 1clq) and the exonuclease mode complex of KF (Protein Data Bank file 1kln). The primer in the polymerase mode is in yellow, and the template is in red, whereas the primer in the exonuclease mode is in dark orange and the template is in cyan. The two white stars in A indicate the approximate locations of the pol and exo active sites in KF. Note that the length of the template strand in KF structure is not long enough to infer interaction of the template overhang with any amino acid residues in the editing mode. To overcome this limitation, we extracted the coordinates of template-primer from the editing complex of RB69 DNA polymerase (Protein Data Bank file 1clq) and superposed it onto the DNA of KF editing complex, using the double-stranded DNA as the point of reference for superposing (B). The template strand in RB69 exonuclease mode is colored in magenta, and the primer is green. The superposition of the DNA (from the exonuclease mode DNA-bound complex of RB69 polymerase) on the polymerase and the exonuclease complex of KlenTaq and KF, respectively, shows an ∼35-Å movement of the primer strand from the pol site to the exo site. A movement of ∼20 Å of the 5′-end of the template strand from its position in the polymerase mode to exonuclease mode is also noted (B). The short template strand in the exonuclease mode DNA-bound crystal structure of KF is now extended by superposition of longer template strand from RB69 exonuclease mode complex. A cluster of charged residues of the RRRY motif (labeled as RRLY, as in the KF sequence) appear in the close vicinity of the template overhang and are rendered in space-filled spheres in A and B. These residues are located within potentially interacting distance with the template overhang. The residue Phe771 of KF is also shown in space-filled spheres in A. Note the large spatial separation between residue Phe771 and the RRRY cluster. It may be pointed out here that the RB69 DNA polymerase is a member of the B family of polymerases, and unlike KF (a member of the A family polymerases), its 3′–5′ exonuclease domain is located on the opposite side of the polymerase active site. The primary amino acid sequence alignment of the region containing RRRY motif from various members of the A family polymerases is shown in C. The conservation of the RRRY motif is emphasized by outlining this region, which is flanked by a conserved proline on the C-terminal side. The significance of other comparatively less conserved residues (e.g. YV and TL) is not clear at this time.
FIGURE 2.
FIGURE 2.
Time course of the polymerase (A) and the 3′–5′ exonuclease (B) activity of the WT and R821A mutant enzymes. DNA polymerase activity was assessed by primer extension assay using 1.5 μm 5′-32P-labeled 14-mer annealed to 32-mer template and 7.5 nm enzyme as described under “Experimental Procedures.” The amount of extension of 14-mer primer to 16-mer (after incorporation of two incoming nucleotides) was quantitated and plotted as a function of time. The gel image of only the WT and R821A enzyme is shown here. The polymerase activity of all of the other mutant enzymes was assessed in a similar manner. B depicts the time course of the 3′–5′ exonuclease activity, using 100 nm 16-mer ssDNA as a substrate and 10 nm enzyme. The gel image shows the pattern of degradation of the 5′-32P-labeled 16-mer DNA by WT and R821A mutant enzyme. Note that the reaction time for the mutant enzyme was much higher than that for the WT enzyme. The 3′–5′ exonuclease activity of other mutant enzymes was assessed similarly. The degradation rates were determined by quantification of the number of cleavage events required to produce a product of defined length, as described by Derbyshire et al. (18). A sum of the total number of cleavage events in the generation of various degradation products of 5′-32P-labeled 16-mer DNA was then plotted as a function of time and fitted to a straight line. The slope of the line provided the rates of polymerase and nuclease activities.
FIGURE 3.
FIGURE 3.
Determination of 3′–5′ exonuclease activity of WT and mutant enzymes using ssDNA under single turnover conditions. The exonucleolytic degradation of 5′-32P-labeled 16-mer (1 nm) by the WT and mutant enzymes is compared under saturating concentrations (125 nm) of the various enzymes (A). Note that the reaction times for some mutant enzymes differed from those used for WT enzymes. Thus, a longer time was needed to observe exonuclease activity of R821A and R822A/Y824A mutant enzymes. The degradation rates were determined as described in the legend to Fig. 2, and a plot obtained is shown in B. The rates calculated from these data are listed in Table 2.
FIGURE 4.
FIGURE 4.
Single-stranded DNA binding affinity for the WT and mutant enzymes. Exonuclease cleavage pattern for the WT (A) and R821A (B) was obtained with ssDNA substrate (1 nm). The WT enzyme concentrations ranged from 25 to 150 nm, whereas the R821A mutant enzyme concentrations varied between 50 and 300 nm. The rates of degradation of ssDNA by varying enzyme concentrations were determined as described in the legend to Fig. 3 and are shown in insets of C (WT) and D (R821A). These rates of ssDNA degradation were then plotted as a function of enzyme concentration (C and D for WT and R821A, respectively) and were fit to a hyperbola to determine KD(ssDNA). Note that the time needed to develop a ssDNA degradation pattern for R821A mutant enzyme ranged from 3 to 15 min. E, the hyperbolic fit of the rates determined by varying the concentration of other mutant enzymes with 1 nm DNA. These plots provided the KD(ssDNA) for R822A, L823A, and Y824A mutant enzymes. The KD(ssDNA) of the double mutant (R822A/Y824A) was determined in similar fashion, and the plot is shown in F. Values of KD(ssDNA) for all enzymes are summarized in Table 2.
FIGURE 5.
FIGURE 5.
Cross-linking of ssDNA to the WT and mutant enzymes. The upper row of bands in A represents the autoradiograph of 32P-labeled 16-mer cross-linked to WT and different mutant enzymes, whereas the lower group of bands in A depicts the Coomassie Blue staining of the proteins used in the cross-linking assay. The cross-linked complexes were resolved by electrophoresis on an 8% SDS-polyacrylamide gel. The gel was exposed to a PhosporImager, and the amount of cross-linking was quantitated using ImageQuant (GE Healthcare). The amount of ssDNA-enzyme cross-linking was expressed as a percentage of WT cross-linking and shown as a bar chart in B.
FIGURE 6.
FIGURE 6.
Exonuclease cleavage rates of WT and mutant enzymes with template-primer containing terminal mismatch (33/14). The reaction conditions were identical to those used for ssDNA. The exonuclease activity was assayed using a 75 nm concentration of the indicated enzyme and 1 nm 33/14 mismatch template-primer. The reactions were quenched after different time intervals (note that the time of incubation for R821A and R882A/Y824A was increased to 60 and 90 s) by the addition of Sanger's stop dye, containing 95% formamide. The products were resolved on 16% polyacrylamide, 8 m urea gel (A). To determine the rates of degradation by the WT and mutant enzymes on one-mismatch template-primer, the amount of primer remaining was plotted as a function of time and fit to a single-exponential decay, using nonlinear regression (B). C shows the representative hyperbolic fit of the rates at various concentrations of WT and R822A/Y824A double mutant enzymes with one-mismatch DNA substrate. The rates at various enzyme concentrations were determined in a manner similar to that shown in B.
FIGURE 7.
FIGURE 7.
Exonuclease-polymerase balance assay of WT and mutant enzymes with template-primer containing terminal mismatch (33/14). Primer extension assays were performed under reaction conditions identical to those used for determining exonucleolytic activity using template-primer containing terminal mismatch, except that reactions were initiated by the addition of 6 mm MgCl2 and 50 μm each of two incoming dNTPs, and aliquots were removed at the indicated times. The products of the exonuclease and polymerase activities were resolved on a 16% polyacrylamide gel containing 8 m urea. The sequence of the 33/14 DNA substrate is shown at the top in A. A shows the gel image of only the WT and R822A/Y824A enzymes. The lanes marked 1–4 in A show the degradation pattern of WT (lanes 1 and 2) and R822A/Y824A mutant enzyme (lanes 3 and 4) with no dNTPs added. B, a plot of the amount of primer extended, as a function of time, fitted to a one-phase exponential association for the WT, L823A, R821A, and R822A/Y824A enzymes. This plot provided the rates for primer extension.
FIGURE 8.
FIGURE 8.
Proposed mode of binding of mismatched template-primer and ssDNA. The binding of template (solid lines) and primer (broken lines) moieties of matched template-primer is shown in A. B, the proposed binding mode of the primer (at the 3′ exo site) and template overhang in mismatched template-primer. Suggested binding of ssDNA is depicted in C. The strand polarity and the position of polymerase and exonuclease active centers are also indicated. Note that the position of template overhang is altered in the polymerase and exonuclease modes of DNA binding. It is stabilized at Phe771 of the O1-helix in the polymerase mode, whereas it binds to the RRRY motif (labeled and depicted as a filled ellipse) during the exonuclease reaction. Note that the binding of ssDNA is probably governed by the strand polarity (5′-3′), and the 5′ portion of the ssDNA and 5′ template overhang in mismatched DNA share a common binding region, the RRRY motif.

Similar articles

Cited by

References

    1. Kornberg, A., and Baker, T. (1992) DNA Replication, p. 130, W. H. Freeman and Co., New York
    1. Brown, T., and Kennard, O. (1992) Curr. Biol. 2 299-299
    1. Seeman, N. C., Rosenberg, J. M., and Rich, A. (1976) Proc. Natl. Acad. Sci. U. S. A. 73 804-808 - PMC - PubMed
    1. Joyce, C. M. (1989) J. Biol. Chem. 264 10858-10866 - PubMed
    1. Spacciapoli, P., and Nossal, N. G. (1994) J. Biol. Chem. 269 438-446 - PubMed

Publication types

LinkOut - more resources