

Interactions of murine APOBEC3 and human APOBEC3G with murine leukemia viruses
- PMID: 18448535
- PMCID: PMC2447093
- DOI: 10.1128/JVI.01357-07
Interactions of murine APOBEC3 and human APOBEC3G with murine leukemia viruses
Abstract
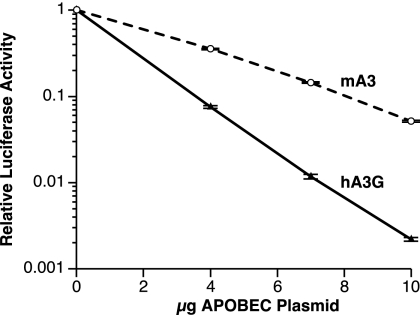
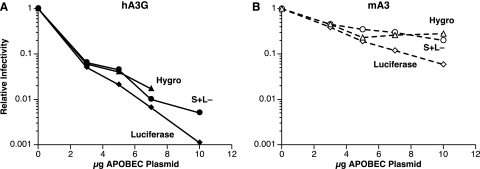
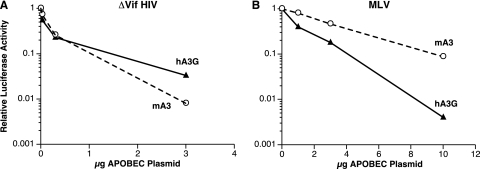
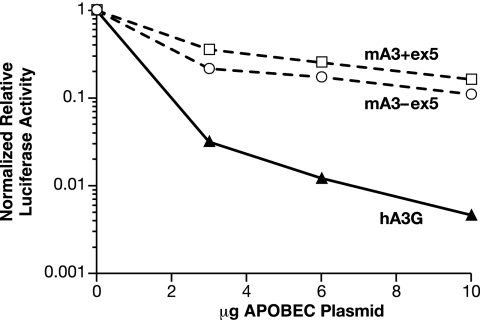
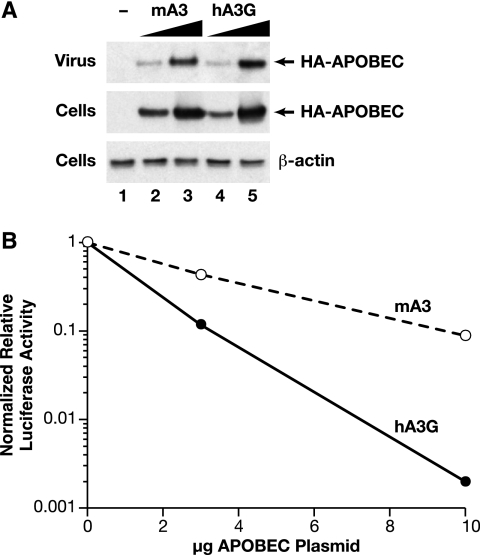
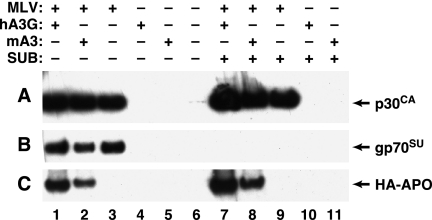
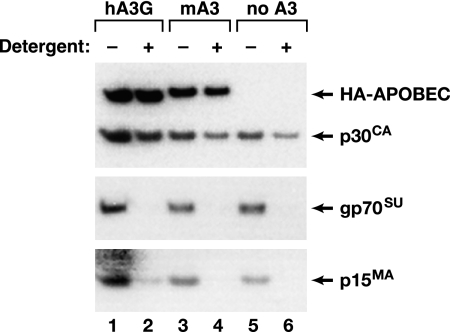
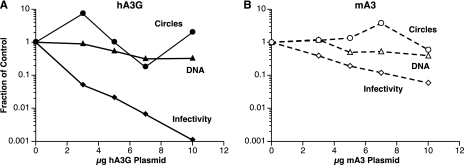
APOBEC3 proteins are cytidine deaminases which help defend cells against retroviral infections. One antiviral mechanism involves deaminating dC residues in minus-strand DNA during reverse transcription, resulting in G-to-A mutations in the coding strand. We investigated the effects of mouse APOBEC3 (mA3) and human APOBEC3G (hA3G) upon Moloney murine leukemia virus (MLV). We find that mA3 inactivates MLV but is significantly less effective against MLV than is hA3G. In contrast, mA3 is as potent against human immunodeficiency virus type 1 (HIV-1, lacking the protective Vif protein) as is hA3G. The two APOBEC3 proteins are packaged to similar extents in MLV particles. Dose-response profiles imply that a single APOBEC3 molecule (or oligomer) is sufficient to inactivate an MLV particle. The inactivation of MLV by mA3 and hA3G is accompanied by relatively small reductions in the amount of viral DNA in infected cells. Although hA3G induces significant levels of G-to-A mutations in both MLV and HIV DNAs, and mA3 induces these mutations in HIV DNA, no such mutations were detected in DNA synthesized by MLV inactivated by mA3. Thus, MLV has apparently evolved to partially resist the antiviral effects of mA3 and to totally resist the ability of mA3 to induce G-to-A mutation in viral DNA. Unlike the resistance of HIV-1 and human T-cell leukemia virus type 1 to hA3G, the resistance of MLV to mA3 is not mediated by the exclusion of APOBEC from the virus particle. The nature of its resistance and the mechanism of inactivation of MLV by mA3 are completely unknown.
Figures
Similar articles
-
Biochemical and biological studies of mouse APOBEC3.J Virol. 2014 Apr;88(7):3850-60. doi: 10.1128/JVI.03456-13. Epub 2014 Jan 22. J Virol. 2014. PMID: 24453360 Free PMC article.
-
The incorporation of APOBEC3 proteins into murine leukemia viruses.Virology. 2008 Aug 15;378(1):69-78. doi: 10.1016/j.virol.2008.05.006. Epub 2008 Jun 24. Virology. 2008. PMID: 18572219
-
Species-specific restriction of apobec3-mediated hypermutation.J Virol. 2008 Feb;82(3):1305-13. doi: 10.1128/JVI.01371-07. Epub 2007 Nov 21. J Virol. 2008. PMID: 18032489 Free PMC article.
-
Cytidine deaminases as a weapon against retroviruses and a new target for antiviral therapy.Mini Rev Med Chem. 2008 Mar;8(3):231-8. doi: 10.2174/138955708783744047. Mini Rev Med Chem. 2008. PMID: 18336343 Review.
-
Tumultuous relationship between the human immunodeficiency virus type 1 viral infectivity factor (Vif) and the human APOBEC-3G and APOBEC-3F restriction factors.Microbiol Mol Biol Rev. 2009 Jun;73(2):211-32. doi: 10.1128/MMBR.00040-08. Microbiol Mol Biol Rev. 2009. PMID: 19487726 Free PMC article. Review.
Cited by
-
Apobec 3G efficiently reduces infectivity of the human exogenous gammaretrovirus XMRV.PLoS One. 2010 Jul 23;5(7):e11738. doi: 10.1371/journal.pone.0011738. PLoS One. 2010. PMID: 20668529 Free PMC article.
-
Mouse APOBEC3 interferes with autocatalytic cleavage of murine leukemia virus Pr180gag-pol precursor and inhibits Pr65gag processing.PLoS Pathog. 2019 Dec 12;15(12):e1008173. doi: 10.1371/journal.ppat.1008173. eCollection 2019 Dec. PLoS Pathog. 2019. PMID: 31830125 Free PMC article.
-
Mouse APOBEC3 expression in NIH 3T3 cells mediates hypermutation of AKV murine leukemia virus.Virology. 2018 May;518:377-384. doi: 10.1016/j.virol.2018.03.014. Epub 2018 Mar 30. Virology. 2018. PMID: 29605684 Free PMC article.
-
Discovery of a novel retrovirus sequence in an Australian native rodent (Melomys burtoni): a putative link between gibbon ape leukemia virus and koala retrovirus.PLoS One. 2014 Sep 24;9(9):e106954. doi: 10.1371/journal.pone.0106954. eCollection 2014. PLoS One. 2014. PMID: 25251014 Free PMC article.
-
Mouse APOBEC3 Restriction of Retroviruses.Viruses. 2020 Oct 27;12(11):1217. doi: 10.3390/v12111217. Viruses. 2020. PMID: 33121095 Free PMC article. Review.
References
-
- Abudu, A., A. Takaori-Kondo, T. Izumi, K. Shirakawa, M. Kobayashi, A. Sasada, K. Fukunaga, and T. Uchiyama. 2006. Murine retrovirus escapes from murine APOBEC3 via two distinct novel mechanisms. Curr. Biol. 161565-1570. - PubMed
-
- Albritton, L. M., L. Tseng, D. Scadden, and J. M. Cunningham. 1989. A putative murine ecotropic retrovirus receptor gene encodes a multiple membrane-spanning protein and confers susceptibility to virus infection. Cell 57659-666. - PubMed
-
- Bassin, R. H., N. Tuttle, and P. J. Fischinger. 1971. Rapid cell culture assay for murine leukaemia virus. Nature 229564-566. - PubMed
-
- Bishop, K. N., R. K. Holmes, A. M. Sheehy, N. O. Davidson, S. J. Cho, and M. H. Malim. 2004. Cytidine deamination of retroviral DNA by diverse APOBEC proteins. Curr. Biol. 141392-1396. - PubMed
Publication types
MeSH terms
Substances
Grants and funding
LinkOut - more resources
Full Text Sources
