. 2008 Jul;82(14):7100-10.
doi: 10.1128/JVI.00403-08. Epub 2008 Apr 30.

The hepatitis E virus ORF3 protein modulates epidermal growth factor receptor trafficking, STAT3 translocation, and the acute-phase response

Affiliations

The hepatitis E virus ORF3 protein modulates epidermal growth factor receptor trafficking, STAT3 translocation, and the acute-phase response

Vivek Chandra et al. J Virol. 2008 Jul.

Abstract

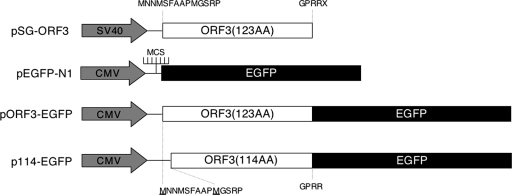
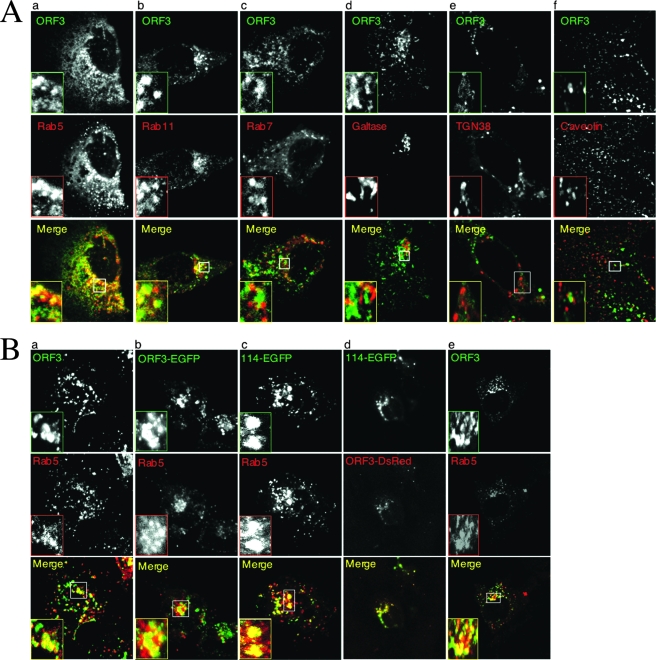
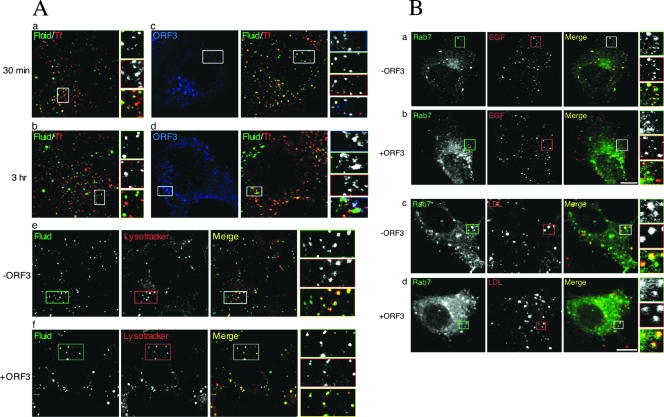
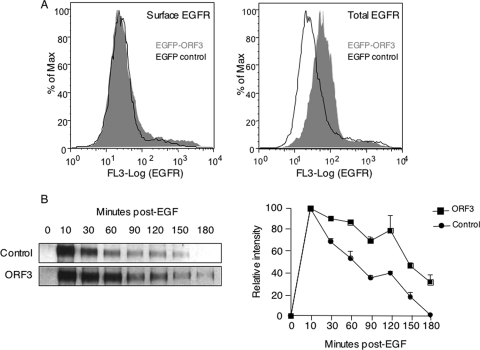
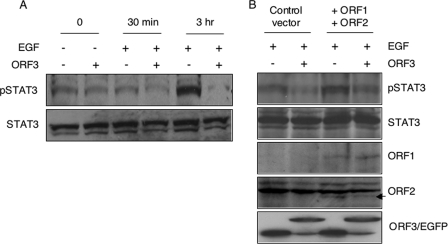
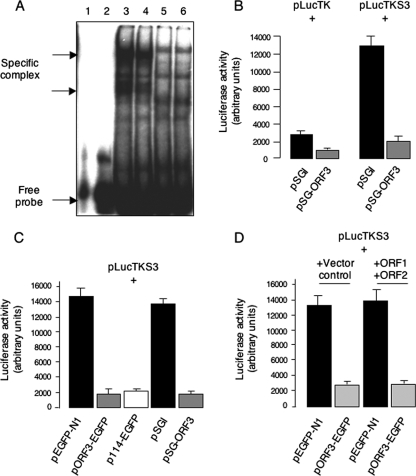
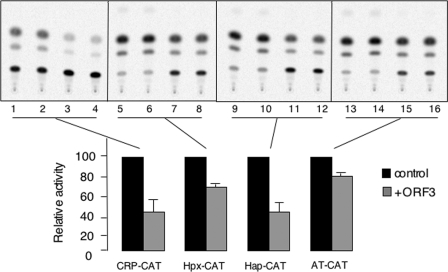
The hepatitis E virus (HEV) causes acute viral hepatitis, but its characterization is hampered by the lack of an efficient in vitro infection system that can be used to study the effects of HEV proteins on cellular processes. Previous studies suggest that the viral ORF3 protein (pORF3) is essential for infection in vivo and is likely to modulate the host response. Here, we report that pORF3 localizes to early and recycling endosomes and causes a delay in the postinternalization trafficking of epidermal growth factor receptor (EGFR) to late endosomes/lysosomes. The cytoplasmic phosphorylated signal transducer and activator of transcription 3 (pSTAT3) proteins require growth factor receptor endocytosis for their translocation from the cytoplasm to nucleus. Consequently, lower levels of pSTAT3 were found in the nuclei of ORF3-expressing Huh7 human hepatoma cells stimulated with EGF. This results in downregulation of the acute-phase response, a major determinant of inflammation in the host. We propose that through its effects on EGFR trafficking, pORF3 prolongs endomembrane growth factor signaling and promotes cell survival. The effects on STAT3 translocation would result in a reduced inflammatory response. Both of these events are likely to contribute positively to viral replication.


Figures

FIG. 1.
FIG. 1.
Schematic illustration of expression vectors used in the study. The vector pSG-ORF3 has been described earlier (18). It carries the 123-aa ORF3 downstream of a simian virus 40 (SV40) promoter-enhancer unit. The N- and C-terminal amino acids of ORF3 are shown. The pEGFP-N1 vector is from Clontech and carries the EGFP gene downstream of a cytomegalovirus (CMV) promoter and a multiple cloning site (MCS). The vector pORF3-EGFP contains the 123-aa ORF3 lacking its stop codon cloned upstream of the EGFP gene. This vector produces a 123-aa ORF3-EGFP fusion protein. The vector p114-EGFP contains the 114-aa ORF3 lacking its stop codon cloned upstream of the EGFP gene. This vector produces a 114-aa ORF3-EGFP fusion protein. The N- and C-terminal amino acids of ORF3 are shown, and the starting methionines are underlined.
FIG. 2.
FIG. 2.
The ORF3 proteins localize to early and recycling endosomes. (A) Huh7 cells were cotransfected with 0.5 μg of plasmid pECFP-ORF3 and 0.5 μg each of one of the following fluorescent fusion constructs to mark intracellular compartments: panel a, Rab5 (early endosomes); panel b, Rab11 (recycling endosomes); panel c, Rab7 (late endosomes); panel d, galtase (cis-Golgi compartment); or panel e, TGN38 (trans-Golgi compartment). Alternatively, Huh7 cells transfected with pECFP-ORF3 were stained with antibodies to caveolin (caveolae) using Alexa 488-conjugated secondary antibodies (panel f). The fixed cells were then imaged by confocal microscopy; the pORF3 and marker signals were pseudocolored green and red, respectively. The merged pictures of single confocal planes are shown. Details are also shown for the boxed regions. At least 50 cells that coexpressed pORF3 and the subcellular marker were imaged in each case. Representative images are shown that were observed in at least 70% of coexpressing cells. (B) Huh7 cells were cotransfected with 0.5 μg each of pRab5-RFP and one of the following: panel a, pSG-ORF3; panel b, pORF3-EGFP; or panel c, p114-EGFP. In panel d, Huh7 cells were cotransfected with p114-EGFP and pORF3-DsRed. The fixed cells were then either imaged directly for fluorescent constructs or stained with rabbit anti-ORF3 and anti-rabbit-Alexa 488 conjugate for the untagged pORF3. The cells were imaged by confocal microscopy. For panels a to c, the pORF3 and Rab5 signals were pseudocolored green and red, respectively. For panel d, the signals of the 114- and 123-aa forms of pORF3 were pseudocolored green and red, respectively. The merged pictures of single confocal planes are shown. Details are also shown for the boxed regions. At least 50 cells that coexpressed pORF3 and the subcellular marker were imaged in each case. For panel e, S10-3 cells were transfected with in vitro synthesized capped replicon transcript followed by the pRab5-RFP construct, as described in Materials and Methods. The cells were fixed and stained for pORF3 expression with rabbit anti-ORF3 and anti-rabbit-Alexa 488 conjugate and were imaged by confocal microscopy. The pORF3 and Rab5 signals were pseudocolored green and red, respectively. The merged pictures of single confocal planes are shown. Details are also shown for the boxed regions. In all cases, representative images are shown that were observed in at least 70% of coexpressing cells.
FIG. 3.
FIG. 3.
Effects of pORF3 on endocytosis and surface receptor trafficking. (A) Fluid uptake and TfR trafficking are not affected by pORF3. Huh7 cells were transfected with 0.5 μg each of either pEGFP-N1 (a and b) or pEGFP-ORF3 (c and d) for 36 h and then serum starved overnight. Cells were then pulsed with 1 mg/ml TMR-dextran and 10 μg/ml Alexa 647-Tf at 37°C for either 30 min (a and c) or 3 h (b and d) and imaged by confocal microscopy. Cells transfected with either pEGFP-N1 (e) or pEGFP-ORF3 (f) were similarly pulsed with Alexa 647-dextran and 5 μM Lysotracker red at 37°C for 2 h and then imaged. Monochrome and pseudocolored details of the boxed regions are shown and coded according to the color assigned for each entity. (B) pORF3 modulates EGFR trafficking. Huh7 cells were cotransfected with 0.5 μg each of pEGFP-Rab7 and either pECFP-N1 (a and c) or pECFP-ORF3 (b and d). After 36 h, the cells were serum starved overnight and then treated at 37°C with either 100 ng/ml rhodamine-EGF for 3 h (a and b) or 10 μg/ml LDL-Dil for 40 min (c and d). Live cells were imaged for the distribution of EGFR, LDLR, Rab7, and pORF3. The merged images as well as the monochromatic distributions from single confocal planes are shown. The pORF3 images are not shown. At least 50 cells that coexpressed pORF3 and the subcellular marker were imaged in each case. Representative images are shown that were observed in at least 70% of coexpressing cells.
FIG. 4.
FIG. 4.
Increased EGFR levels in ORF3-expressing cells. (A) Flow cytometric analysis of surface or total EGFR in Huh7 cells transfected with 2 μg of either pEGFP-N1 (black line) or pEGFP-ORF3 (gray area). Single-parameter histograms are shown for EGFP-positive cells. From two independent experiments, the MFI values were the following: for surface expression, MFIs were 34.4 ± 2.3 and 30.9 ± 2.0 in ORF3 and control cells, respectively; for total expression, MFIs were 68.8 ± 0.6 and 34.2 ± 2.5 in ORF3 and the total cell population, respectively. The P values for the two sets, calculated using a Student's t test, were 0.282 for surface expression and 0.017 for total expression. (B) Huh7 cells were transfected as above and 40 h later serum starved for 12 h. The cells were then pulsed with 100 ng/ml EGF for the indicated times. Cell lysates containing equal amounts of total protein were immunoprecipitated with anti-EGFR and then Western blotted with anti-pTyr antibodies. The phospho-EGFR signals are shown. The graph on the right shows decay curves, taking the highest intensity (at 10 min post-EGF) to be 100%. The gel and decay curves are representative of three separate experiments. Max, maximum.
FIG. 5.
FIG. 5.
Modulation of STAT3 nuclear transport by pORF3. (A) Huh7 cells were transfected with 2 μg of either pEGFP-N1 (−) or pEGFP-ORF3 (+). After 36 h the cells were serum starved overnight and either treated with 100 ng/ml EGF (+) or not (−) for the indicated times at 37°C. Nuclear lysates prepared from these cells were Western blotted with anti-pSTAT3 or anti-STAT3 antibodies. (B) Huh7 cells were transfected with 1.5 μg of either pEGFP-N1 (−) or pEGFP-ORF3 (+) along with 3 μg of pSGI (control vector) or a mixture of 1.5 μg each of pSG-ORF1 and pSG-ORF2, as indicated. After 36 h the cells were serum starved overnight and treated with 100 ng/ml EGF for 3 h at 37°C. Nuclear lysates prepared from these cells were Western blotted with anti-pSTAT3 or anti-STAT3 antibodies. As expression controls, whole-cell lysates from identically transfected and treated cells were Western blotted with anti-ORF1, anti-ORF2, or anti-EGFP antibodies. In the ORF2 plane, the arrow indicates the specific band; the nonspecific bands served as loading controls. In the ORF3/EGFP plane, the upper and lower bands represent the EGFP-ORF3 fusion protein and EGFP, respectively.
FIG. 6.
FIG. 6.
pORF3 downregulates STAT3 transcriptional activity. (A) EMSA using 32P-labeled wild-type and mutant STAT3 probes and nuclear lysates prepared from Huh7 cells transfected with 2 μg of pSG-ORF3 or the control vector pSGI. Lane 1, mutant probe; lane 2, wild-type probe; lane 3, wild-type probe and control lysate; lane 4, wild-type probe and ORF3 lysate; lane 5, mutant probe and control lysate; lane 6, mutant probe and ORF3 lysate. The positions of free probe and specific complexes are indicated. (B) Huh7 cells were cotransfected with plasmids pLucTK (1 μg) or pLucTKS3 (1 μg) together with either plasmid pSGI (2 μg) or pSG-ORF3 (2 μg). Cell lysates containing equal amounts of total protein were quantitated for luciferase activity as described in Materials and Methods. (C) Huh7 cells were cotransfected with plasmid pLucTKS3 (1 μg) together with 2 μg each of one of the indicated plasmids: pEGFP-N1 (control), pORF3-EGFP (123-aa EGFP-fused ORF3), p114-EGFP (114-aa EGFP-fused ORF3), pSGI (control), or pSG-ORF3 (untagged ORF3). Cell lysates containing equal amounts of total protein were quantitated for luciferase activity. (D) Huh7 cells were cotransfected with plasmid pLucTKS3 (1 μg) together with pEGFP-N1 or pORF3-EGFP (1.5 μg) and either pSGI (3 μg) or a mixture of pSG-ORF1 and pSG-ORF2 (1.5 μg), as indicated. Cell lysates containing equal amounts of total protein were quantitated for luciferase activity. For panels B to D, each transfection was in triplicate. The results from a single experiment are shown and are typical of three independent experiments.
FIG. 7.
FIG. 7.
pORF3 downregulates the acute-phase genes. Huh7 cells were cotransfected with 0.5 μg each of the indicated acute-phase gene promoter-reporter construct and 2 μg of either the pSGI (control) or the pSG-ORF3 construct. After 48 h, the cell lysates were prepared, and equal amounts of protein were used for CAT assays. Each transfection is shown in duplicate for control (lanes 1, 2, 5, 6, 9, 10, 13, and 14) and ORF3-transfected (lanes 3, 4, 7, 8, 11, 12, 15, and 16) cells. The results shown are representative of two separate experiments. The bar graph shown below the gel reflects the average percent CAT activity in the presence of ORF3, taking the activity in its absence as 100%.

References

    1. Alonzi, T., D. Maritano, B. Gorgoni, G. Rizzuto, C. Libert, and V. Poli. 2001. Essential role of STAT3 in the control of the acute-phase response as revealed by inducible gene inactivation [correction of activation] in the liver. Mol. Cell. Biol. 211621-1632. (Erratum, 21:2967.) - PMC - PubMed
    1. Bild, A. H., J. Turkson, and R. Jove. 2002. Cytoplasmic transport of Stat3 by receptor-mediated endocytosis. EMBO J. 213255-3263. - PMC - PubMed
    1. Bowman, T., R. Garcia, J. Turkson, and R. Jove. 2000. STATs in oncogenesis. Oncogene 192474-2488. - PubMed
    1. Burke, P., K. Schooler, and H. S. Wiley. 2001. Regulation of epidermal growth factor receptor signaling by endocytosis and intracellular trafficking. Mol. Biol. Cell 121897-1910. - PMC - PubMed
    1. Carpenter, G. 2000. The EGF receptor: a nexus for trafficking and signaling. Bioessays 22697-707. - PubMed

Publication types