

Urinary proteomics in diabetes and CKD
- PMID: 18448586
- PMCID: PMC2440301
- DOI: 10.1681/ASN.2007091025
Urinary proteomics in diabetes and CKD
Abstract
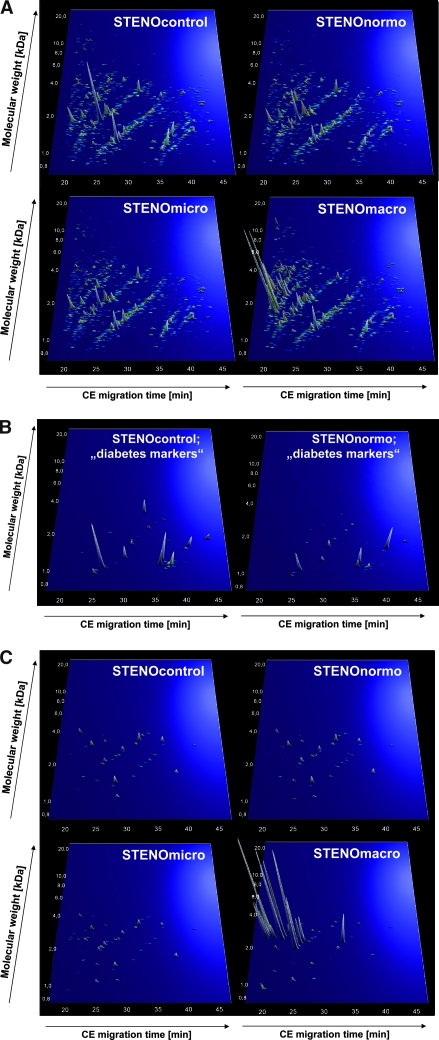
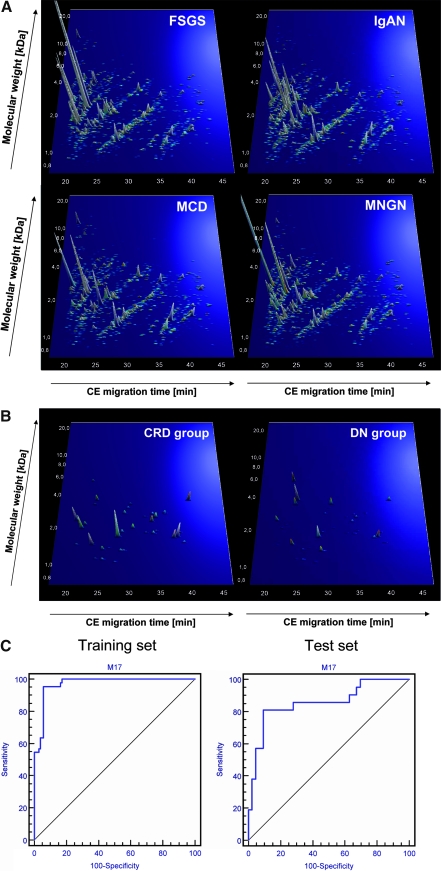
Urinary biomarkers for diabetes, diabetic nephropathy, and nondiabetic proteinuric renal diseases were sought. For 305 individuals, biomarkers were defined and validated in blinded data sets using high-resolution capillary electrophoresis coupled with electrospray-ionization mass spectrometry. A panel of 40 biomarkers distinguished patients with diabetes from healthy individuals with 89% sensitivity and 91% specificity. Among patients with diabetes, 102 urinary biomarkers differed significantly between patients with normoalbuminuria and nephropathy, and a model that included 65 of these correctly identified diabetic nephropathy with 97% sensitivity and specificity. Furthermore, this panel of biomarkers identified patients who had microalbuminuria and diabetes and progressed toward overt diabetic nephropathy over 3 yr. Differentiation between diabetic nephropathy and other chronic renal diseases reached 81% sensitivity and 91% specificity. Many of the biomarkers were fragments of collagen type I, and quantities were reduced in patients with diabetes or diabetic nephropathy. In conclusion, this study shows that analysis of the urinary proteome may allow early detection of diabetic nephropathy and may provide prognostic information.
Figures
Similar articles
-
Changes in urine proteome accompanying diabetic nephropathy progression.Pol Arch Med Wewn. 2015;125(1-2):27-38. doi: 10.20452/pamw.2640. Epub 2015 Jan 12. Pol Arch Med Wewn. 2015. PMID: 25578432
-
Urinary proteomics for early diagnosis in diabetic nephropathy.Diabetes. 2012 Dec;61(12):3304-13. doi: 10.2337/db12-0348. Epub 2012 Aug 7. Diabetes. 2012. PMID: 22872235 Free PMC article.
-
Identification of nephropathy predictors in urine from children with a recent diagnosis of type 1 diabetes.J Proteomics. 2019 Feb 20;193:205-216. doi: 10.1016/j.jprot.2018.10.010. Epub 2018 Oct 24. J Proteomics. 2019. PMID: 30366120 Clinical Trial.
-
[Early detection by urinary proteome analysis : A new concept in patient management of diabetic nephropathy].Internist (Berl). 2020 Oct;61(10):1094-1105. doi: 10.1007/s00108-020-00863-4. Internist (Berl). 2020. PMID: 32897404 German.
-
The diabetic kidney: from hyperfiltration and microalbuminuria to end-stage renal failure.Med Clin North Am. 1988 Nov;72(6):1465-92. doi: 10.1016/s0025-7125(16)30717-9. Med Clin North Am. 1988. PMID: 3054363 Review.
Cited by
-
Mass spectrometry for diabetic nephropathy monitoring: new effective tools for physicians.ISRN Endocrinol. 2012;2012:768159. doi: 10.5402/2012/768159. Epub 2012 May 20. ISRN Endocrinol. 2012. PMID: 22685672 Free PMC article.
-
Urinary Proteome Analysis Identified Neprilysin and VCAM as Proteins Involved in Diabetic Nephropathy.J Diabetes Res. 2018 Apr 29;2018:6165303. doi: 10.1155/2018/6165303. eCollection 2018. J Diabetes Res. 2018. PMID: 29854824 Free PMC article.
-
Thyroid Parameters and Kidney Disorder in Type 2 Diabetes: Results from the METAL Study.J Diabetes Res. 2020 Mar 28;2020:4798947. doi: 10.1155/2020/4798947. eCollection 2020. J Diabetes Res. 2020. PMID: 32337292 Free PMC article.
-
Identification of 22 novel loci associated with urinary biomarkers of albumin, sodium, and potassium excretion.Kidney Int. 2019 May;95(5):1197-1208. doi: 10.1016/j.kint.2018.12.017. Epub 2019 Mar 12. Kidney Int. 2019. PMID: 30910378 Free PMC article.
-
Proteomic characterization of obesity-related nephropathy.Clin Kidney J. 2020 Apr 15;13(4):684-692. doi: 10.1093/ckj/sfaa016. eCollection 2020 Aug. Clin Kidney J. 2020. PMID: 32905225 Free PMC article.
References
-
- Fliser D, Novak J, Thongboonkerd V, Argiles A, Jankowski V, Girolami M, Jankowski J, Mischak H: Advances in urinary proteome analysis and biomarker discovery. J Am Soc Nephrol 18: 1057–1071, 2007 - PubMed
-
- Kolch W, Neususs C, Pelzing M, Mischak H: Capillary electrophoresis-mass spectrometry as a powerful tool in clinical diagnosis and biomarker discovery. Mass Spectrom Rev 24: 959–977, 2005 - PubMed
-
- Theodorescu D, Wittke S, Ross MM, Walden M, Conaway M, Just I, Mischak H, Frierson HF: Discovery and validation of new protein biomarkers for urothelial cancer: a prospective analysis. Lancet Oncol 7: 230–240, 2006 - PubMed
-
- Zimmerli LU, Schiffer E, Zurbig P, Kellmann M, Mouls L, Pitt A, Coon JJ, Schmiederer RE, Mischak H, Peter K, Kolch W, Delles C, Dominiczak AF: Urinary proteomic biomarkers in coronary artery disease. Mol Cell Proteomics 7: 290–298, 2008 - PubMed
-
- Mischak H, Kaiser T, Walden M, Hillmann M, Wittke S, Herrmann A, Knueppel S, Haller H, Fliser D: Proteomic analysis for the assessment of diabetic renal damage in humans. Clin Sci (Lond) 107: 485–495, 2004 - PubMed
Publication types
MeSH terms
Substances
Grants and funding
LinkOut - more resources
Full Text Sources
Other Literature Sources
Medical
