. 2008 Apr 30;28(18):4624-34.
doi: 10.1523/JNEUROSCI.5355-07.2008.

Silent synapses in developing rat nucleus tractus solitarii have AMPA receptors

Affiliations

Silent synapses in developing rat nucleus tractus solitarii have AMPA receptors

Bénédicte Balland et al. J Neurosci. .

Abstract

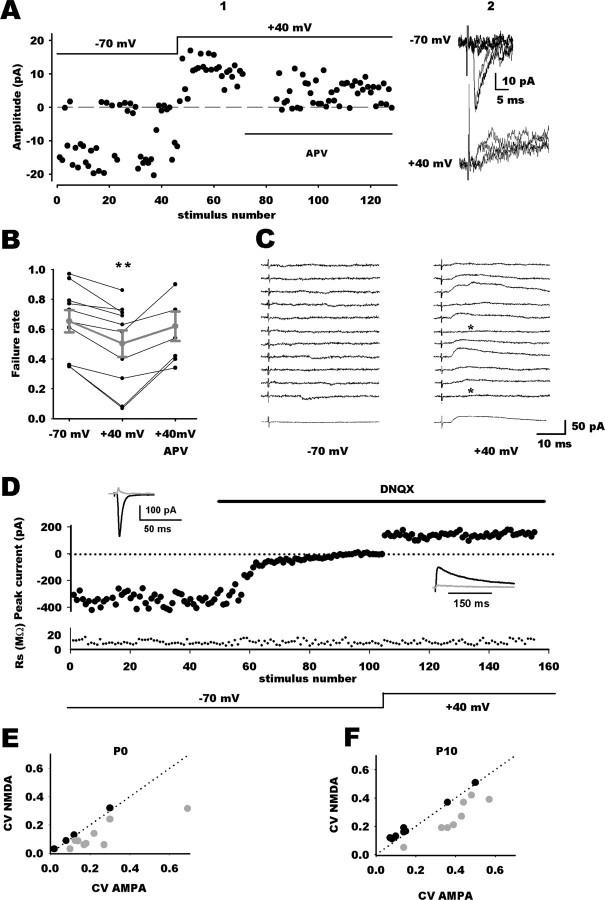
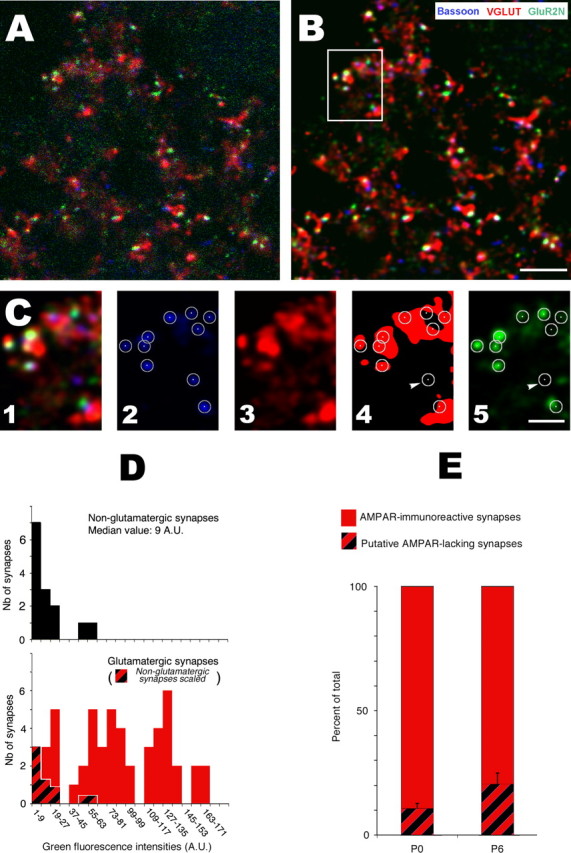
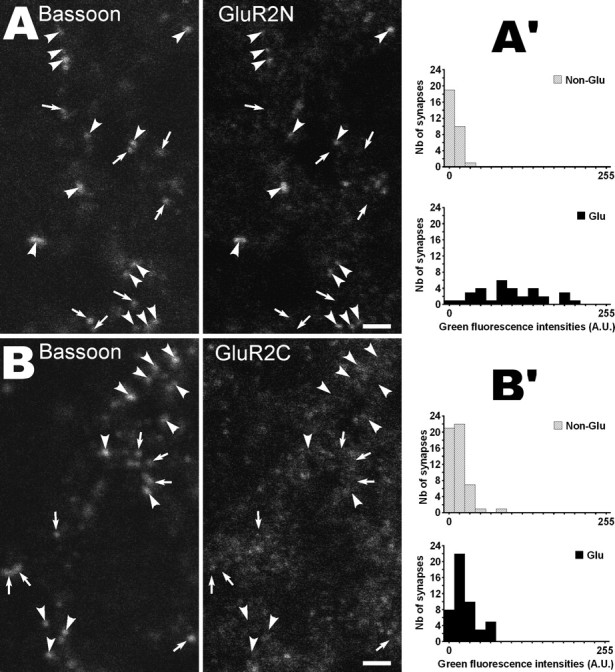
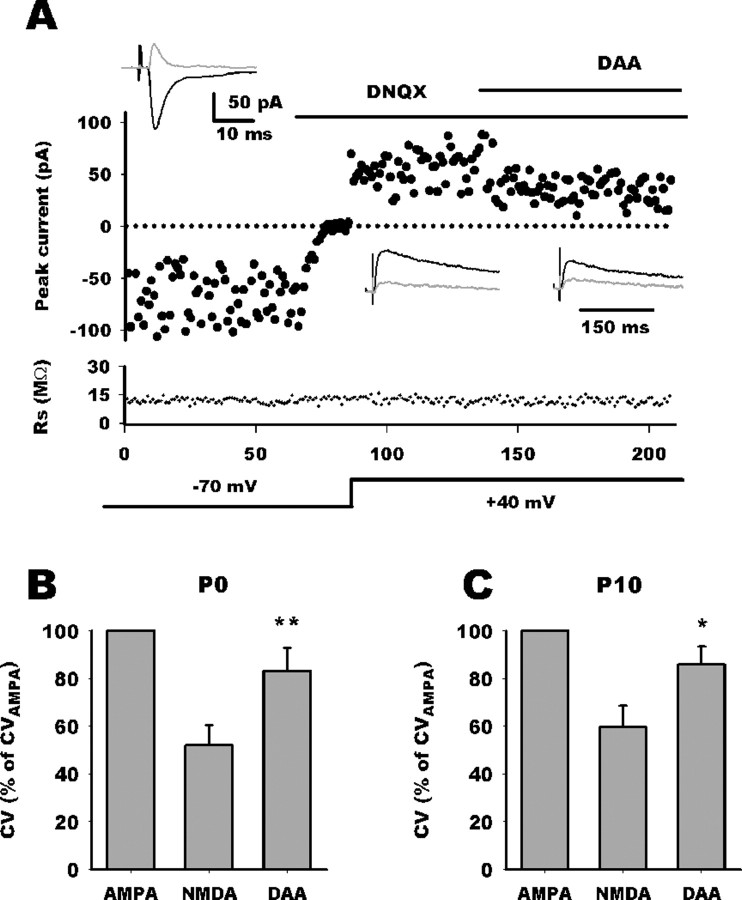
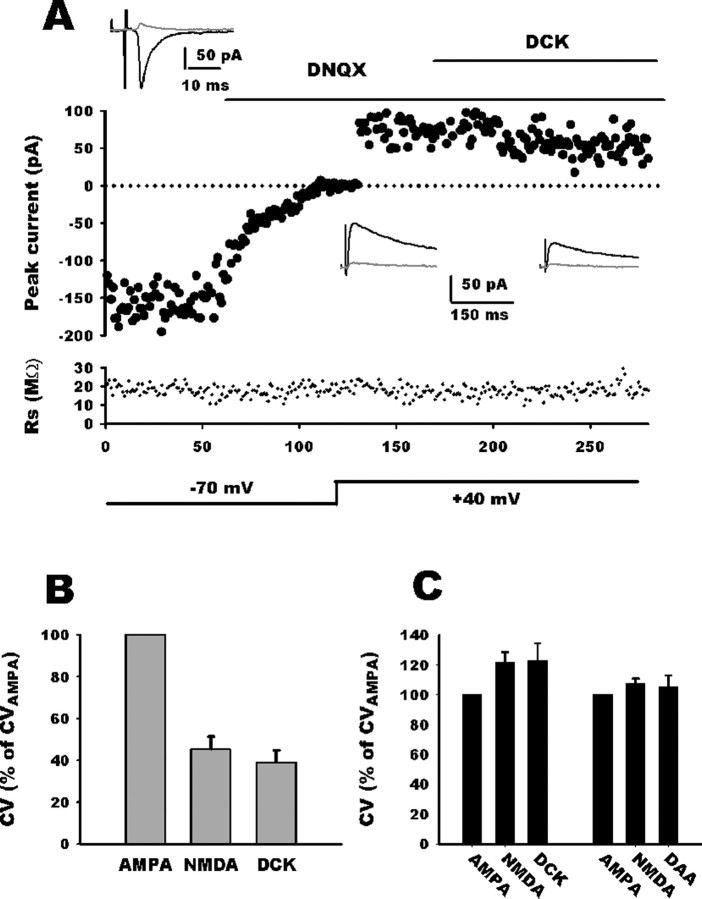
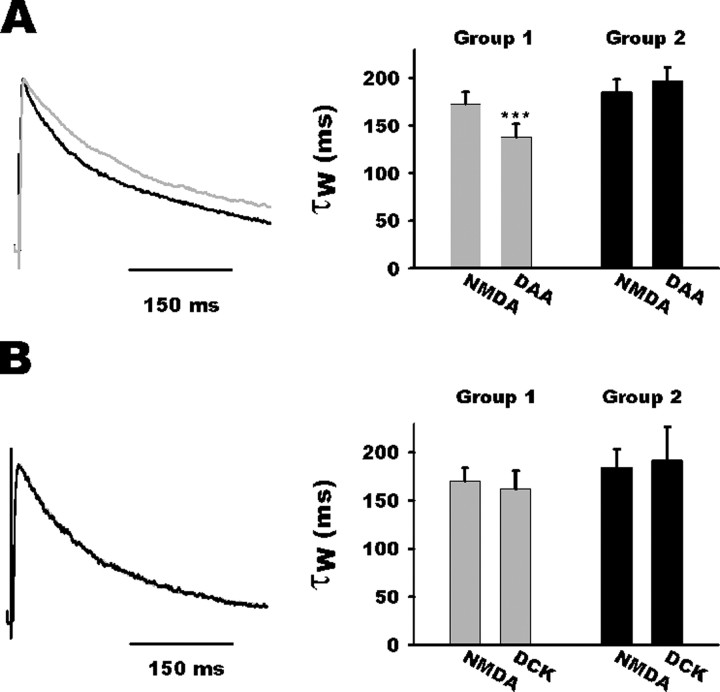
NMDA-only synapses, called silent synapses, are thought to be the initial step in synapse formation in several systems. However, the underlying mechanism and the role in circuit construction are still a matter of dispute. Using combined morphological and electrophysiological approaches, we searched for silent synapses at the level of the nucleus tractus solitarii (NTS), a brainstem structure that is a gateway for many visceral sensory afferent fibers. Silent synapses were detected at birth by using electrophysiological recordings and minimal stimulation protocols. However, anatomical experiments indicated that nearly all, if not all, NTS synapses had AMPA receptors. Based on EPSC fluctuation measurements and differential blockade by low-affinity competitive and noncompetitive glutamate antagonists, we then demonstrated that NTS silent synapses were better explained by glutamate spillover from neighboring fibers and/or slow dynamic of fusion pore opening. Glutamate spillover at immature NTS synapses may favor crosstalk between active synapses during development when glutamate transporters are weakly expressed and contribute to synaptic processing as well as autonomic circuit formation.


Figures

Figure 1.
Figure 1.
Silent inputs in the developing NTS. A1, Individual response amplitudes recorded at −70 and +40 mV holding potentials as a function of the stimulus number. Dashed line indicates the mean noise level. At −70 mV, responses are a mixture of successes and failures of synaptic transmission. Depolarization reduced the failure rate. Addition of APV, an NMDAR antagonist, restored failure rate to control values. A2, Superimposed individual traces from the experiment shown in A1 at −70 mV and +40 mV holding potentials. B, Summary graph of minimal stimulation experiments at P0 showing the different failure rate at hyperpolarized (n = 10) and depolarized (n = 10) membrane potentials and in the presence of APV (n = 6). Gray traces are mean values ± SEM. C, Example of a silent synapse at P0 showing exclusively NMDAR-mediated transmission. Right column, At +40 mV, TS stimulation did not induce synaptic response (bottom trace is the average of 40 traces, indicating that synaptic responses were undetectable because of a low signal-to-noise ratio). Left column, At −70 mV, TS stimulation revealed pure NMDA responses. Failures are indicated by asterisks, bottom trace is the average of 40 traces. D, Comparison of EPSC variance mediated by AMPARs and NMDARs. EPSC amplitudes are plotted against stimulus number, with holding potential and application of DNQX indicated schematically. Access resistance magnitude (Rs) is plotted against stimulus number. Top black traces represent average traces in the different conditions, and the gray traces are SDs. E, F, Plots of CVAMPA against CVNMDA at P0 (E) or P10 (F). The dotted lines are the identity lines. In both graphs, gray circles represent values for group 1 neurons (CVAMPA > CVNMDA) and black circles for group 2 neurons (CVAMPA ≤ CVNMDA).
Figure 2.
Figure 2.
Quantifying AMPAR expression in NTS glutamatergic synapses. A, Single high-resolution confocal section from a P0 rat NTS showing simultaneous immunodetection of glutamatergic terminals (VGLUTs, red), presynaptic active zones (Bassoon, blue), and AMPARs (GluR2, green). B, Same optical section after deconvolution. C, High-magnification images of the boxed area in B illustrating the different steps used for quantitative analysis. C1, Composite image (3 channels). C2, Delineation of synapses by circles using a fixed radius (180 nm) and centers of bassoon puncta on the blue channel. C3, C4, Delineation of glutamatergic terminal by threshold segmentation of the red (VGLUTs) channel. Synapses (bassoon puncta from C2) were identified as glutamatergic or nonglutamatergic depending on their distance between their centers and the nearest VGLUT-immunoreactive terminal. Synapses were considered nonglutamatergic (one indicated by arrowhead) when centers were located more than one pixel (58 nm) away from VGLUT immunoreactivity. C5, Measurements of fluorescence levels on the GluR2 channel (green Alexa Fluor-488 emission) within synaptic circles. D, Distribution histograms of fluorescence intensities (green Alexa Fluor-488 emission) in glutamatergic (red, bottom) and nonglutamatergic (black, top) synapses. The proportion of putative AMPAR-lacking synapses (immunonegative synapses; red and black strips in the bottom) was estimated by scaling the distribution histogram of nonglutamatergic synapses against that of glutamatergic synapses using the first class as reference. A.U., Arbitrary units. E, Proportion of AMPA-immunoreactive synapses and putative AMPAR-lacking synapses in the NTS of P0 (n = 5) and P6 (n = 4) rats. Scale bars: B, 5 μm; C, 2 μm.
Figure 3.
Figure 3.
Effects of epitope location on AMPA receptor detection after antigen retrieval by microwaves (P0 rat NTS). A, B, Bassoon and GluR2 channels from two triple-labeled single confocal sections (VGLUT channels not shown). GluR2 detection was performed with an antibody recognizing the extracellular N-terminal part of the protein (GluR2N) in A and with an antibody directed against the intracellular C-terminal tail (GluR2C) in B. Arrowheads and arrows indicate glutamatergic and nonglutamatergic synapses, respectively (i.e., bassoon spots with or without VGLUT immunolabeling). Note that GluR2 immunofluorescence is mainly found at glutamatergic synapses in A but not in B. A′, B′, Distributions of fluorescence intensities produced by the GluR2N antibody (A′) and the GluR2C antibody (B′) in glutamatergic and nonglutamatergic synapses. Quantification was performed as described for Figure 2A. Significant difference between the two distributions was found in A′ (p < 0.02) but not in B′ (p > 0.99). Scale bars, 2 μm. A.U., Arbitrary units.
Figure 4.
Figure 4.
Competitive NMDA antagonist selectively restores CV. A, Comparison of EPSC variance mediated by AMPARs and NMDARs. EPSC amplitudes are plotted against stimulus number with holding potential and application of DNQX and d-AA indicated schematically. Access resistance magnitude is plotted against stimulus number. Top black traces represent average traces in the different conditions, and the gray traces are SDs. For this P0 neuron, CVAMPA was 0.6 and CVNMDA was 0.35. Application of d-AA decreased NMDA current and increased CV to 0.42. B, C, Bar histograms summarizing d-AA effect on CVNMDA relative to CVAMPA at P0 and P10 in group 1 neurons. For neurons whose CVNMDA was smaller than CVAMPA, application of d-AA nearly restored CVNMDA (DAA) to control values. *p < 0.05; **p < 0.01.
Figure 5.
Figure 5.
Noncompetitive NMDA antagonist does not alter CVNMDA. A, Comparison of EPSC variance mediated by AMPARs and NMDARs. EPSC amplitudes are plotted against stimulus number with holding potential and application of DNQX and DCK indicated schematically. Access resistance magnitude is plotted against stimulus number. Top black traces represent average traces in the different conditions, and the gray traces are SDs. For this neuron, CVAMPA was 0.32, and CVNMDA was 0.25. Application of DCK decreased NMDA current but did not increase CVNMDA (0.23). B, Bar histogram summarizing DCK effect on CVNMDA relative to CVAMPA. In group 1 neurons (CVNMDA < CVAMPA), application of DCK did not alter CVNMDA (DCK). C, In group 2 neurons (CVNMDA ≥ CVAMPA), application of DCK or d-AA did not alter CVNMDA.
Figure 6.
Figure 6.
Competitive NMDA antagonist selectively speeds up NMDA EPSC deactivation kinetic. A, Left, Normalized average traces of NMDA EPSC before (gray trace) and after d-AA (DAA; black trace) application for a group 1 neuron. Note acceleration of the decay during d-AA application. Right, Bar histogram summarizing d-AA effect on NMDA current kinetics in both groups. Note that d-AA accelerated NMDA current decay in group 1 neurons (gray bars) but not in group 2 neurons (black bars). B, Left, Normalized average traces of NMDA EPSC before (gray trace) and after (black trace) DCK application. Note the unaltered kinetics during DCK application. Right, Bar histogram summarizing the absence of DCK effect on NMDA current kinetics in both groups.

Similar articles

Cited by

References

    1. Aamodt SM, Constantine-Paton M. The role of neural activity in synaptic development and its implications for adult brain function. Adv Neurol. 1999;79:133–144. - PubMed
    1. Abrahamsson T, Gustafsson B, Hanse E. Synaptic fatigue at the naive perforant path–dentate granule cell synapse in the rat. J Physiol (Lond) 2005;569:737–750. - PMC - PubMed
    1. Andresen MC, Kunze DL. Nucleus tractus solitarius-gateway to neural circulatory control. Annu Rev Physiol. 1994;56:93–116. - PubMed
    1. Arnth-Jensen N, Jabaudon D, Scanziani M. Cooperation between independent hippocampal synapses is controlled by glutamate uptake. Nat Neurosci. 2002;5:325–331. - PubMed
    1. Asztely F, Erdemli G, Kullmann DM. Extrasynaptic glutamate spillover in the hippocampus: dependence on temperature and the role of active glutamate uptake. Neuron. 1997;18:281–293. - PubMed

Publication types

MeSH terms

Substances

LinkOut - more resources