. 2008 Apr 30;28(18):4690-701.
doi: 10.1523/JNEUROSCI.5633-07.2008.

Activation of the amyloid cascade in apolipoprotein E4 transgenic mice induces lysosomal activation and neurodegeneration resulting in marked cognitive deficits

Affiliations

Activation of the amyloid cascade in apolipoprotein E4 transgenic mice induces lysosomal activation and neurodegeneration resulting in marked cognitive deficits

Haim Belinson et al. J Neurosci. .

Abstract

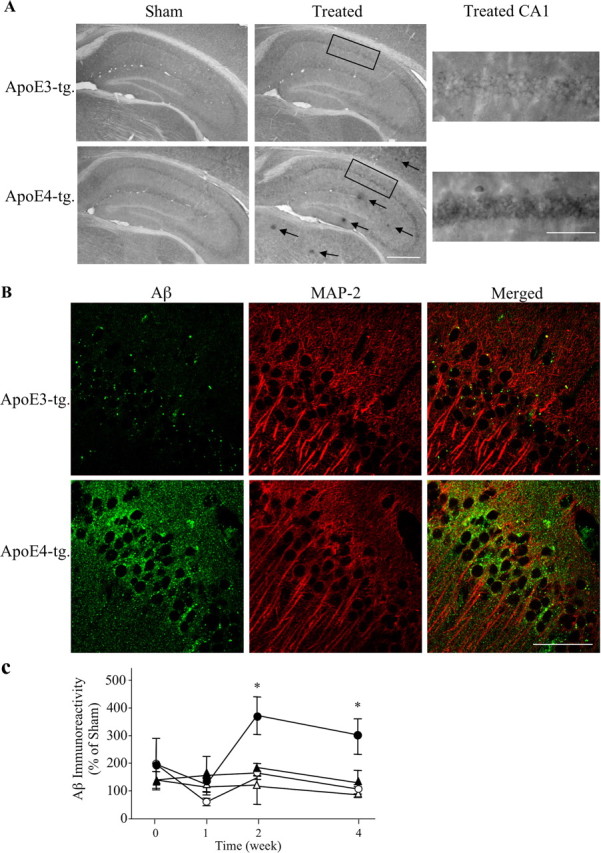
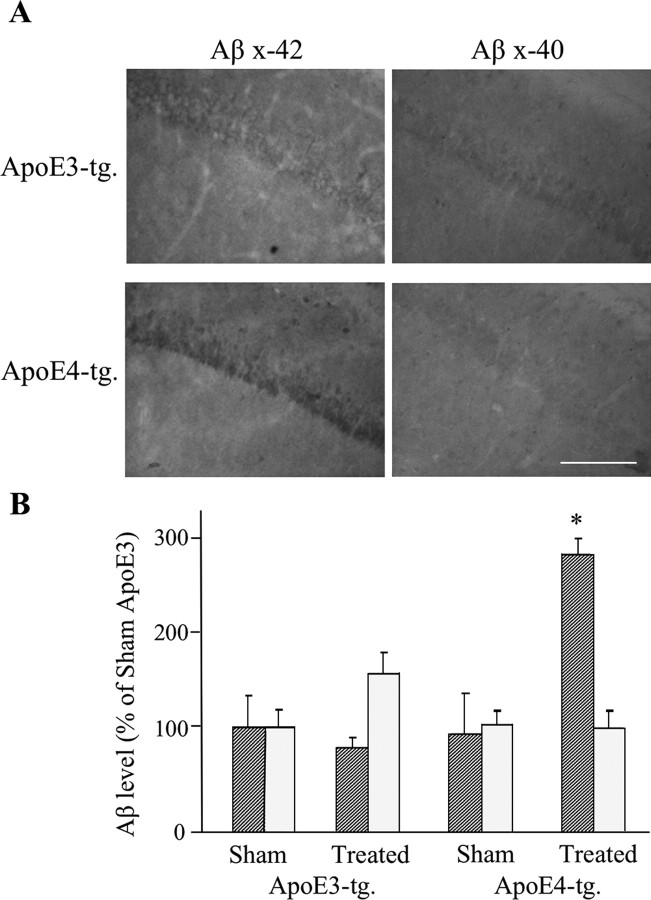
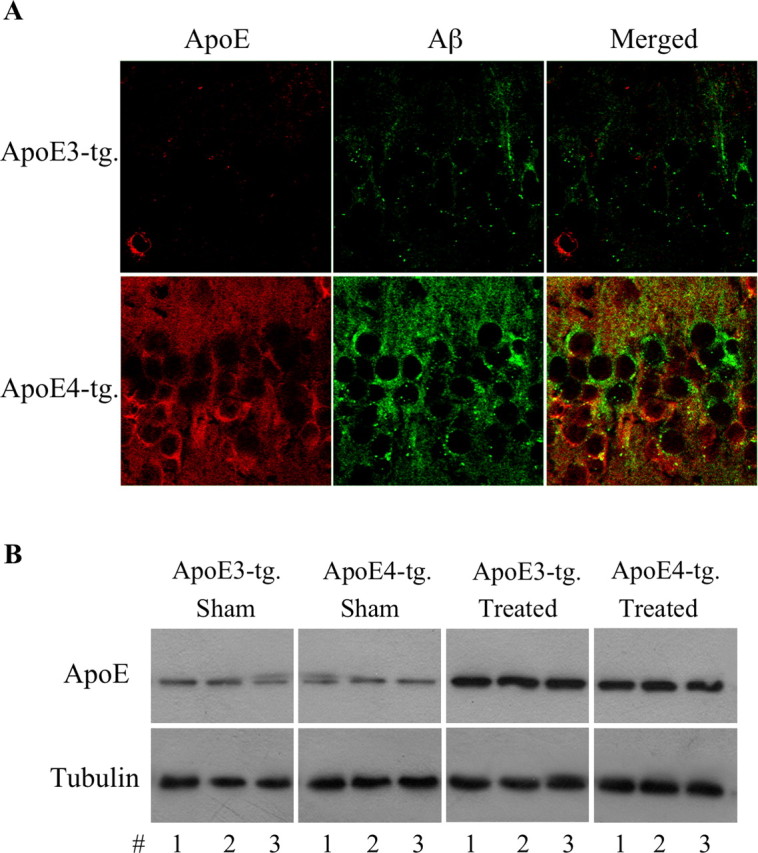
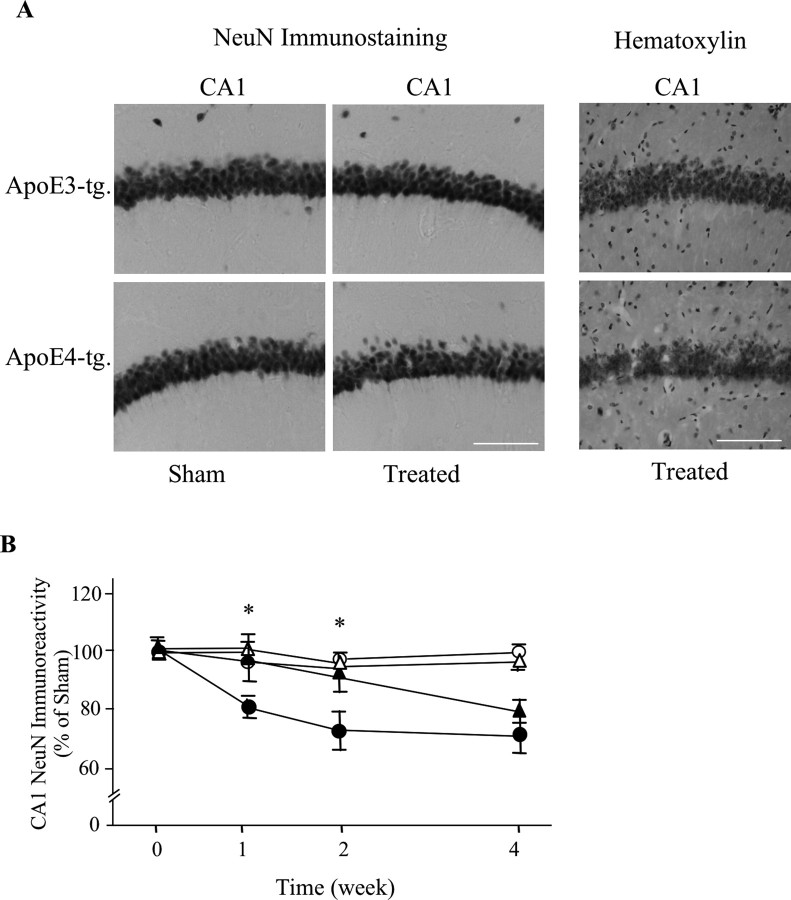
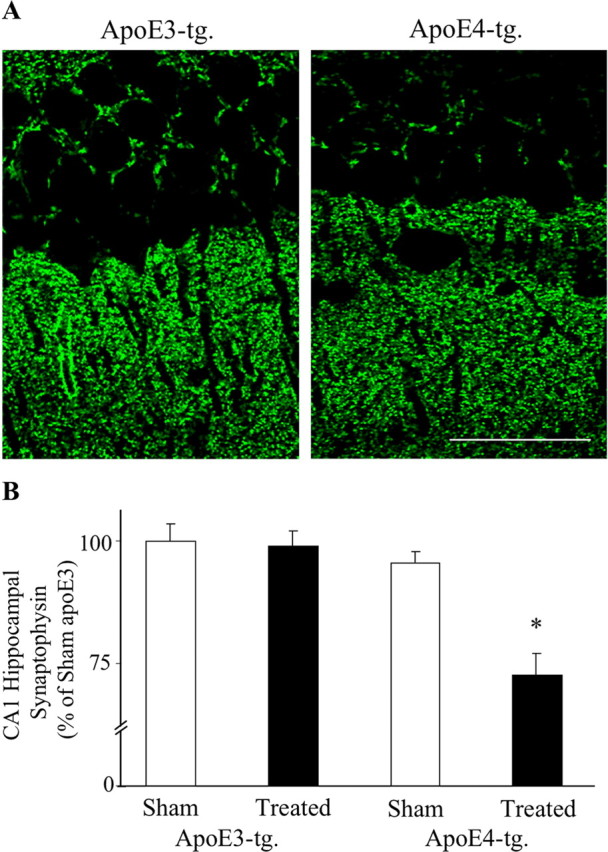
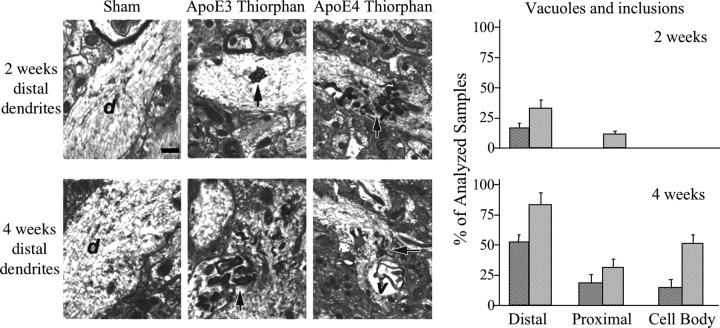
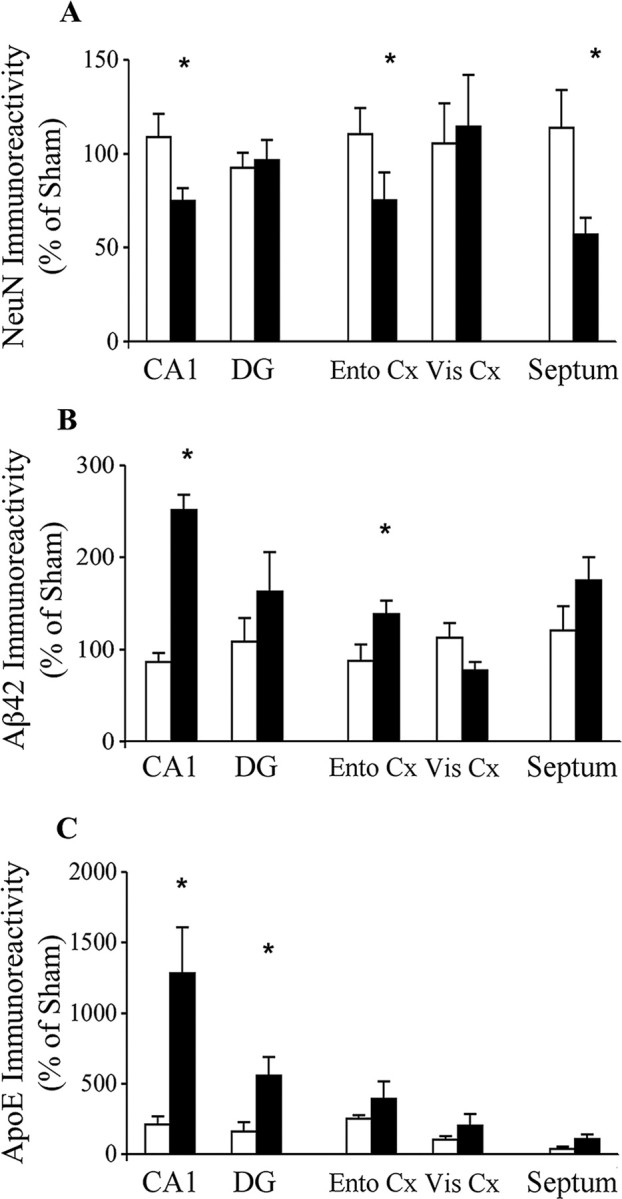
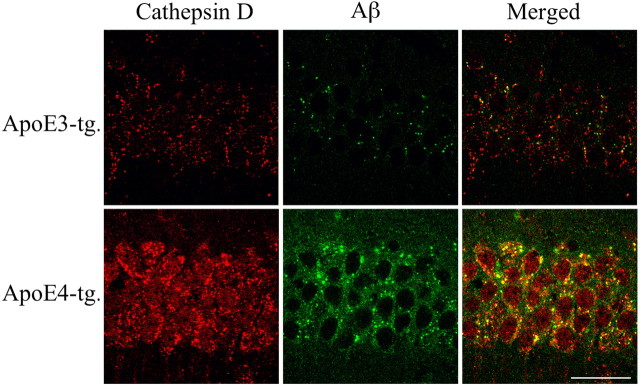
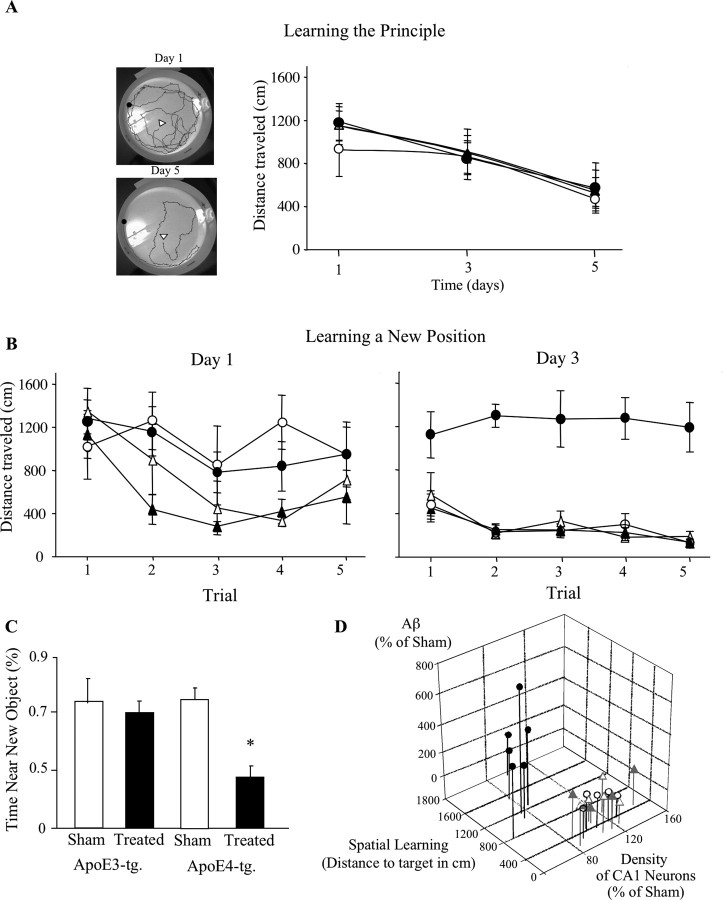
The allele E4 of apolipoprotein E (apoE4), the most prevalent genetic risk factor for Alzheimer's disease, is associated histopathologically with elevated levels of brain amyloid. This led to the suggestion that the pathological effects of apoE4 are mediated by cross-talk interactions with amyloid beta peptide (Abeta), which accentuate the pathological effects of the amyloid cascade. The mechanisms underlying the Abeta-mediated pathological effects of apoE4 are unknown. We have shown recently that inhibition of the Abeta-degrading enzyme neprilysin in brains of wild-type apoE3 and apoE4 mice results in rapid and similar elevations in their total brain Abeta levels. However, the nucleation and aggregation of Abeta in these mice were markedly affected by the apoE genotype and were specifically enhanced in the apoE4 mice. We presently used the neprilysin inhibition paradigm to analyze the neuropathological and cognitive effects that are induced by apoE4 after activation of the amyloid cascade. This revealed that apoE4 stimulates isoform specifically the degeneration of hippocampal CA1 neurons and of entorhinal and septal neurons, which is accompanied by the accumulation of intracellular Abeta and apoE and with lysosomal activation. Furthermore, these neuropathological effects are associated isoform specifically with the occurrence of pronounced cognitive deficits in the ApoE4 mice. These findings provide the first in vivo evidence regarding the cellular mechanisms underlying the pathological cross talk between apoE4 and Abeta, as well as a novel model system of neurodegeneration in vivo that is uniquely suitable for studying the early stages of the amyloid cascade and the effects thereon of apoE4.


Figures

Figure 1.
Figure 1.
Accumulation of extracellular and intracellular Aβ deposits in apoE3 and apoE4 mice after inhibition of neprilysin. ApoE3 and apoE4 mice were injected intracerebroventricularly using Alzet mini pumps with the neprilysin inhibitor thiorphan for 2 weeks or sham injected, after which the brains were processed for immunohistochemistry and confocal microscopy, as described in Materials and Methods. A, Coronal sections of sham- and thiorphan-treated apoE3 and apoE4 mice that were stained immunohistochemically with the anti-Aβ mAb 4G8. The left panels depict extracellular Aβ deposits (arrows), which are present specifically in the thiorphan-treated apoE4 mice. Scale bar, 500 μm. The rectangles indicate the CA1 subfield shown at a higher magnification in the right panels. Scale bar, 100 μm. They depict the specific accumulation of Aβ in the CA1 hippocampal field of the thiorphan-treated apoE4 mice. B, Double-labeling confocal microscopy of Aβ (left), the cytoplasmic marker MAP-2 (middle), and their merged images (right) in the thiorphan-treated apoE3 and apoE4 mice. Scale bar, 50 μm. C, Kinetics analysis and quantitation of the levels of Aβ in CA1 hippocampal neurons of apoE3 and apoE4 mice after inhibition of neprilysin. Results were obtained from coronal sections at bregma −2.5 stained immunohistochemically with mAb 4G8 and were analyzed at the indicated time points in terms of the fraction of the CA1 field stained for Aβ as described in Materials and Methods. They are presented (mean ± SE of n = 5 per group × treatment) as the percentage of the sham-treated apoE3 mice. The symbols ▴ and • represent the thiorphan-treated apoE3 and apoE4 mice, whereas ▵ and ○ represent the corresponding sham-treated mice (*p < 0.04 for comparing the results of the thiorphan-treated apoE4 with those of the other mouse groups).
Figure 2.
Figure 2.
Accumulation of Aβ42 and Aβ40 in CA1 neurons of apoE3 and apoE4 mice after inhibition of neprilysin. The mice were injected intracerebroventricularly, using Alzet mini pumps, with the neprilysin inhibitor thiorphan for 2 weeks or sham injected, after which the brains were processed for immunohistochemistry, as described in Materials and Methods. Results shown are from coronal sections at bregma −2.5, which were stained with anti-Aβ42 (Chemicon) and anti-Aβ40 antisera (Chemicon). Scale bar, 100 μm. Quantitation of the results (mean ± SE; n = 5 per group × treatment) was performed by computerized densitometry, as described in Materials and Methods, and is presented for each of the Aβ stainings as a percentage of the sham-treated apoE3 mice. The striped and dotted bars correspond, respectively, to Aβ42 and Aβ40 (*p < 0.005 for comparison of the thiorphan-treated apoE4 with the other mouse groups).
Figure 3.
Figure 3.
The levels of brain apoE in apoE3 and apoE4 mice after inhibition of neprilysin. ApoE3 and apoE4 mice were injected intracerebroventricularly, using Alzet mini pumps, with the neprilysin inhibitor thiorphan for 2 weeks or sham injected, after which the brains were processed for confocal microscopy and immunoblot assays, as described in Materials and Methods. A, Double-labeling confocal microscopy of apoE (left) and Aβ (middle) of CA1 neurons and their merged images (right) in the thiorphan-treated apoE3 and apoE4 mice. Scale bar, 50 μm. As shown, the thiorphan-treated apoE4 mice contain higher levels of apoE in CA1 neurons than do the corresponding apoE3 mice. Importantly, the Aβ and apoE of the apoE4 mice do not fully overlap in the CA1 neurons. B, Immunoblots of brain apoE of thiorphan- and sham-treated apoE3 and apoE4 mice, including tubulin gel-loading controls.
Figure 4.
Figure 4.
Neuronal loss in the hippocampus of apoE3 and apoE4 mice after inhibition of neprilysin. ApoE3 and apoE4 mice were injected intracerebroventricularly, using Alzet mini pumps, with thiorphan- or sham-injected for the indicated times. Their brains were then excised and sectioned, after which they were stained immunohistochemically, with antisera directed against the neuronal marker NeuN, and histochemically with hematoxylin, as described in Materials and Methods. A, Representative NeuN-stained sections of the CA1 hippocampal subfield of thiorphan- and sham-treated apoE3 and apoE4 mice. The panels on the right depict sections of CA1 neurons of the thiorphan-treated mice that were stained histochemically with hematoxylin. Scale bar, 100 μm. B, Computerized densitometric analysis of the kinetics of the effects of apoE and thiorphan on the loss of hippocampal CA1 neurons. Results were obtained from coronal sections at bregma −2.5, which were stained immunohistochemically for NeuN and were analyzed, as described in Materials and Methods, in terms of the fraction of the CA1 field stained for NeuN. They are presented (mean ± SE of n = 5 per group × treatment) as the percentage of sham-treated apoE3 mice. The symbols ▴ and • represent the thiorphan-treated apoE3 and apoE4 mice, whereas ▵ and ○ represent the corresponding sham-treated mice (*p < 0.03 for comparing the kinetics and volumetric results of the thiorphan-treated apoE4 mice with those of the other mouse groups).
Figure 5.
Figure 5.
Synaptic loss in the hippocampus of apoE3 and apoE4 mice after inhibition of neprilysin. ApoE3 and apoE4 mice were injected intracerebroventricularly, using Alzet mini pumps, with thiorphan for 2 weeks or were sham injected. The brains were then excised and sectioned, after which they were stained immunohistochemically and visualized by confocal microscopy, as described in Materials and Methods. A, Representative sections of the CA1 hippocampal subfield (bregma −2.5) of thiorphan-treated apoE3 and apoE4 mice. Scale bar, 50 μm. B, Computerized densitometric analysis of the synaptic levels of thiorphan- and sham-treated apoE3 and apoE4 mice. Results shown were obtained from coronal sections at bregma −2.5, as described in Materials and Methods, and are presented (mean ± SE; n = 5 per group × treatment) as → percentage of the sham-treated apoE3 mice (*p < 0.05 for comparing the thiorphan-treated apoE4 with the other mouse groups).
Figure 6.
Figure 6.
Ultrastructural alterations in CA1 neurons of thiorphan-treated apoE3 and apoE4 mice. The apoE transgenic mice were injected intracerebroventricularly with thiorphan or were sham treated for the indicated time, after which their brains were processed and visualized by electron microscopy (magnification, 10,000×), as described in Materials and Methods. At 2 weeks after thiorphan treatment of the apoE3 mice, scattered flat vacuoles and inclusions in the distal dendrites (top middle) were observed, whereas in the apoE4 mice, at this time point, abundant flat vacuoles and inclusions in the distal dendrites (top right) were observed. At 4 weeks after thiorphan treatment of apoE3 mice, flat vacuoles and inclusions in the distal dendrites (bottom middle) were observed, whereas in the apoE4 mice, at this time point, there was further elevation in the levels of flat vacuoles and inclusions in the distal dendrites (bottom right). The neuronal inclusions in the different sections are indicted by arrows, whereas dendrites and vacuole are indicated by d and v, respectively. Sham controls are depicted in the left panels. Semiquantitative analysis of the vacuolar neuronal pathology at 2 and 4 weeks was performed as described in Materials and Methods, and the results obtained are depicted in the graphs on the right. The dark and light bars correspond, respectively, to the thiorphan-treated apoE3 and apoE4 mice.
Figure 7.
Figure 7.
Brain area specificity of the effects of thiorphan on NeuN, intracellular Aβ42, and ApoE in distinct brain areas of apoE4 and ApoE3 transgenic mice. The mice were injected using Alzet mini pumps with the neprilysin inhibitor thiorphan for 2 weeks or were sham injected, after which their brains were sectioned and stained immunohistochemically (NeuN and Aβ42) and for immunofluorescence (ApoE), and the results were quantified, as described in Materials and Methods. Results of the CA1 and DG neurons and of the entorhinal (Ento Cx) and visual cortex (Vis Cx) were obtained from the same section (bregma −2.5). However, the septum was stained using sections of bregma 0.6. Results shown (mean ± SE of 5 per group × treatment for each brain area) are presented as a percentage of sham-treated ApoE3 mice. The black and white bars correspond, respectively, to thiorphan-treated apoE4 and apoE3 mice (*p < 0.03 for comparing the results of the thiorphan-treated apoE4 with those of the other mouse groups).
Figure 8.
Figure 8.
Lysosomal localization of Aβ in CA1 neurons of apoE3 and apoE4 mice after inhibition of neprilysin. The apoE transgenic mice were injected intracerebroventricularly with thiorphan for 2 weeks, after which their brains were excised, sectioned, and subjected to cathepsin D and Aβ double-labeling confocal microscopy, as described in Materials and Methods. Laser confocal images in red are of the lysosomal marker cathepsin-D (left), whereas images in green are of Aβ (mAb 4G8) (middle), and their merged images are depicted in the right panels. Images are from the hippocampal CA1 region. Scale bar, 50 μm. As shown, apoE4-treated mice have higher punctated and diffuse lysosomal staining than the corresponding apoE3 mice. Moreover, thiorphan-treated apoE4 mice but not apoE3 mice exhibit extensive accumulation of intracellular Aβ that colocalizes with cathepsin D.
Figure 9.
Figure 9.
The effects of apoE and thiorphan on learning and memory. ApoE3 and apoE4 mice were injected intracerebroventricularly with thiorphan or sham treated for up to 3 weeks and subjected to a spatial navigation learning and memory test and to an object recognition test, as described in Materials and Methods. A, The mice were tested, starting at day 5, after initiation of the thiorphan treatment, for their ability to locate a water-filled well in an open field (5 trials/d for 6 consecutive days). Results shown represent the path length traversed per trial by the mice at the indicated days (mean ± SE; n = 5 per group × treatment). Representative trajectories obtained on days 1 and 5 are depicted on the left. The positions of the starting point of the mice and of the water-filled wells are denoted by a filled square and an arrowhead, respectively. B, The position of the water-filled well was changed, and the performance of the mice was then monitored for 3 consecutive days (5 trials/d), during which the position of the water-filled well was unchanged. Results shown (mean ± SE of n = 5 mice per group × treatment) were obtained on the first and third days after the position of the well was changed. The symbols ▴ and • represent the thiorphan-treated apoE3 and apoE4 mice, whereas ▵ and ○ represent the corresponding sham-treated mice. C, Object recognition. The black bars correspond to thiorphan-treated mice, whereas the white bars represent the corresponding sham-treated mice. As shown, the thiorphan-treated apoE4 mice did not exhibit a preference to either the novel or the previously seen object, whereas all the other groups had a preference toward the new object. Two-way ANOVA revealed p = 0.02 for group × treatment, which was associated with a significant difference between the performance of the thiorphan-treated apoE4 mice and those of the other mouse groups (p < 0.007; t test, post hoc analysis). D, A three-dimensional chart summary of the effects of apoE and thiorphan on the neurodegeneration and Aβ contents of CA1 hippocampal neurons and on learning and memory, of the individual sham- and thiorphan-treated apoE3 and apoE4 mice. Results shown were adapted from Figures 2B, 4C, and 9B. The symbols ▴ and • correspond to thiorphan-treated apoE3 and apoE4 mice, whereas ▵ and ○ represent the corresponding sham-treated mice. The results of the apoE4 mice are attached to black lines, whereas those of the apoE3 mice are attached to gray lines.

References

    1. Alzheimer A, Stelzmann RA, Schnitzlein HN, Murtagh FR. An English translation of Alzheimer's 1907 paper, “Uber eine eigenartige Erkankung der Hirnrinde.”. Clin Anat. 1995;8:429–431. - PubMed
    1. Arendt T, Schindler C, Bruckner MK, Eschrich K, Bigl V, Zedlick D, Marcova L. Plastic neuronal remodeling is impaired in patients with Alzheimer's disease carrying apolipoprotein ε4 allele. J Neurosci. 1997;17:516–529. - PMC - PubMed
    1. Brendza RP, Bales KR, Paul SM, Holtzman DM. Role of apoE/Abeta interactions in Alzheimer's disease: insights from transgenic mouse models. Mol Psychiatry. 2002;7:132–135. - PubMed
    1. Casas C, Sergeant N, Itier JM, Blanchard V, Wirths O, van der Kolk N, Vingtdeux V, van de Steeg E, Ret G, Canton T, Drobecq H, Clark A, Bonici B, Delacourte A, Benavides J, Schmitz C, Tremp G, Bayer TA, Benoit P, Pradier L. Massive CA1/2 neuronal loss with intraneuronal and N-terminal truncated Abeta42 accumulation in a novel Alzheimer transgenic model. Am J Pathol. 2004;165:1289–1300. - PMC - PubMed
    1. Cataldo AM, Barnett JL, Pieroni C, Nixon RA. Increased neuronal endocytosis and protease delivery to early endosomes in sporadic Alzheimer's disease: neuropathologic evidence for a mechanism of increased β-amyloidogenesis. J Neurosci. 1997;17:6142–6151. - PMC - PubMed

Publication types

MeSH terms