Comparative Study
. 2008 Apr 30;28(18):4756-66.
doi: 10.1523/JNEUROSCI.0141-08.2008.

Structural insights into aberrant topological patterns of large-scale cortical networks in Alzheimer's disease

Affiliations
Comparative Study

Structural insights into aberrant topological patterns of large-scale cortical networks in Alzheimer's disease

Yong He et al. J Neurosci. .

Abstract

Recent research on Alzheimer's disease (AD) has shown that cognitive and memory decline in this disease is accompanied by disrupted changes in the coordination of large-scale brain functional networks. However, alterations in coordinated patterns of structural brain networks in AD are still poorly understood. Here, we used cortical thickness measurement from magnetic resonance imaging to investigate large-scale structural brain networks in 92 AD patients and 97 normal controls. Brain networks were constructed by thresholding cortical thickness correlation matrices of 54 regions and analyzed using graph theoretical approaches. Compared with controls, AD patients showed decreased cortical thickness intercorrelations between the bilateral parietal regions and increased intercorrelations in several selective regions involving the lateral temporal and parietal cortex as well as the cingulate and medial frontal cortex regions. Specially, AD patients showed abnormal small-world architecture in the structural cortical networks (increased clustering and shortest paths linking individual regions), implying a less optimal topological organization in AD. Moreover, AD patients were associated with reduced nodal centrality predominantly in the temporal and parietal heteromodal association cortex regions and increased nodal centrality in the occipital cortex regions. Finally, the brain networks of AD were about equally as robust to random failures as those of controls, but more vulnerable against targeted attacks, presumably because of the effects of pathological topological organization. Our findings suggest that the coordinated patterns of cortical morphology are widely altered in AD patients, thus providing structural evidence for disrupted integrity in large-scale brain networks that underlie cognition. This work has implications for our understanding of how functional deficits in patients are associated with their underlying structural (morphological) basis.


Figures
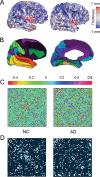
Figure 1.
Figure 1.
A flowchart for the construction of structural cortical networks. A, Two representative cortical thickness maps (left for a control subject and right for an AD subject) were obtained from anatomical MRI by computational neuroanatomy. The color bar indicating the range of thickness is shown on the right. B, The entire cerebral cortex was segmented into 54 cortical areas that were displayed on the average cortex (left for the lateral surface and right for the medial surface), each color representing an individual region. C, The correlation matrices were obtained by calculating partial correlations between regional thickness across subjects within each group (left for the control group and right for the AD group). The color bar indicating the partial correlation coefficient between regions is shown on the top. D, The correlation matrices of C were thresholded into the binarized matrices (left for the control group and right for the AD group) by a sparsity threshold of 13%. Such a threshold ensures that the networks of both of the groups have the same number of nodes and links (i.e., the two networks have the same wiring cost). NC, Normal controls. For details, see Materials and Methods.
Figure 2.
Figure 2.
Small-world properties of structural cortical networks. The graphs show the changes in the γ (Cpreal/Cprand, gray lines) and λ (Lpreal/Lprand, black lines) in the structural networks of both the control (left panel) and AD (right panel) groups as a function of sparisty thresholds. At a wide range of sparsity, both networks have γ > 1 (i.e., the real networks show high clustering compared with 1000 rewiring random networks) and λ ∼ 1 (i.e., the real networks show approximately equivalent path length compared with 1000 rewiring random networks), which implies prominent small-world properties (see Materials and Methods). Note that, as the values of sparsity thresholds increase, the γ values decrease rapidly, but the λ values only change slightly. The black arrows point to a range of sparsity in which the small-world properties are estimable because the average degrees of networks are larger than log(N) (N is the number of node regions) (Watts and Strogatz 1998; Achard et al., 2006; He et al., 2007b). NC, Normal controls.
Figure 3.
Figure 3.
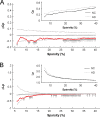
Between-group differences in clustering coefficient (Cp) and path length (Lp) as a function of sparsity. A, The graph shows the differences (red circles) in the Cp between the controls and AD patients as a function of sparsity thresholds. The gray lines represent the mean values (open circles) and 95% confidence intervals of the between-group differences obtained 1000 permutation tests at each sparsity value. The arrows indicate significant (p < 0.05) difference in Cp between the two groups. Note that AD patients (dotted lines) show larger Cp values in the brain networks than controls (solid lines) over a wide range of thresholds (inset). B, The graph shows the differences (red circles) in the Lp between the controls and AD patients as a function of sparsity thresholds. The gray lines represent the mean values (open circles) and 95% confidence intervals of the between-group differences obtained 1000 permutation tests at each sparsity value. The arrows indicate significant (p < 0.05) difference in Lp between the two groups. Note that AD patients (dotted lines) show larger Lp values in the brain networks than controls (solid lines) over a wide range of thresholds (inset). NC, Normal controls.
Figure 4.
Figure 4.
Between-group differences in areas under the clustering coefficient (CpAUC) and path length (LpAUC) curves. A, The graph shows the differences (black square) in the CpAUC between the controls and AD patients. The black lines represent the mean values (open circles) and 95% confidence intervals of the between-group differences obtained 1000 permutation tests. Note that the AD patients show larger CpAUC values in the brain networks compared with the controls (p = 0.03). B, The graph shows the differences (black square) in the LpAUC between the controls and AD patients. The black lines represent the mean values (open circles) and 95% confidence intervals of the between-group differences obtained 1000 permutation tests. Note that the AD patients show larger LpAUC values in the brain networks compared with the controls (p = 0.05). For the Cp and Lp curves of the controls and AD groups, see the insets of Figure 3. NC, Normal controls.
Figure 5.
Figure 5.
The size of the largest connected component of structural cortical networks. The graph shows the largest component size of the networks in the control (gray line) and AD group (black line) as a function of sparsity threshold. As the threshold increases, the largest component sizes of both groups tend to increase. The arrow indicates that the lowest sparsity threshold (13%) in which both of the networks included all connected nodes (i.e., 54 regions) defined in the brain template.
Figure 6.
Figure 6.
AD-related changes in nodal betweenness centrality. A, The graph shows the differences (green square) in normalized betweenness bi for each region between the controls and AD patients. The gray circles and bar lines represent the mean values and 95% confidence intervals of the between-group differences obtained from 1000 permutation tests, respectively. Significant decreases in bi in the AD patients were found in the right ANG (a), left ANG (b), and right STG (c), and significant increases in the left LOTG (d), left LING (g), and right cingulate (h). B, Regions showing significant AD-related changes in bi were mapped to anatomical space in the controls (left) and AD (right) groups. Regions showing AD-related decreases are colored in cyan and regions showing AD-related increases are colored in red. The black lines represent the links of the networks. Note that these results were obtained from the brain networks with a sparsity of 13%. NC, Normal controls. For the abbreviations of regions, see supplemental Table 1 (available at www.jneurosci.org as supplemental material).
Figure 7.
Figure 7.
Topological robustness in structural cortical networks. The graphs show the relative size of the largest connected component as a function of the fraction of removed nodes (A) and links (B) by random failures (left) or targeted attacks (right). The brain network in the AD patients (black line) was approximately as robust as that in the controls (gray line) in response to random failures. However, it displayed remarkably reduced stability against targeted attack compared with the control network. Note that both brain networks used here had a same sparsity value of 13%. NC, Normal controls.

Comment in

Similar articles

Cited by

References

    1. Achard S, Bullmore E. Efficiency and cost of economical brain functional networks. PLoS Comput Biol. 2007;3:e17. - PMC - PubMed
    1. Achard S, Salvador R, Whitcher B, Suckling J, Bullmore E. A resilient, low-frequency, small-world human brain functional network with highly connected association cortical hubs. J Neurosci. 2006;26:63–72. - PMC - PubMed
    1. Albert R, Jeong H, Barabasi AL. Error and attack tolerance of complex networks. Nature. 2000;406:378–382. - PubMed
    1. Andrews TJ, Halpern SD, Purves D. Correlated size variations in human visual cortex, lateral geniculate nucleus, and optic tract. J Neurosci. 1997;17:2859–2868. - PMC - PubMed
    1. Backman L, Almkvist O, Nyberg L, Andersson J. Functional changes in brain activity during priming in Alzheimer's disease. J Cogn Neurosci. 2000;12:134–141. - PubMed

Publication types