

Thromboxane receptor activation mediates isoprostane-induced increases in amyloid pathology in Tg2576 mice
- PMID: 18448655
- PMCID: PMC6670429
- DOI: 10.1523/JNEUROSCI.0684-08.2008
Thromboxane receptor activation mediates isoprostane-induced increases in amyloid pathology in Tg2576 mice
Abstract
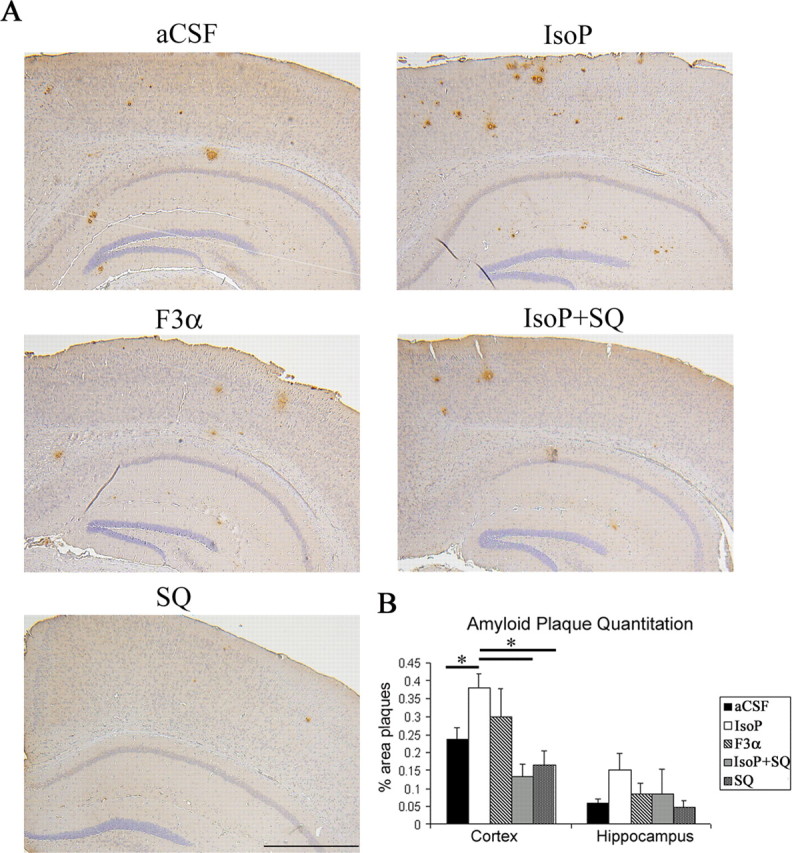
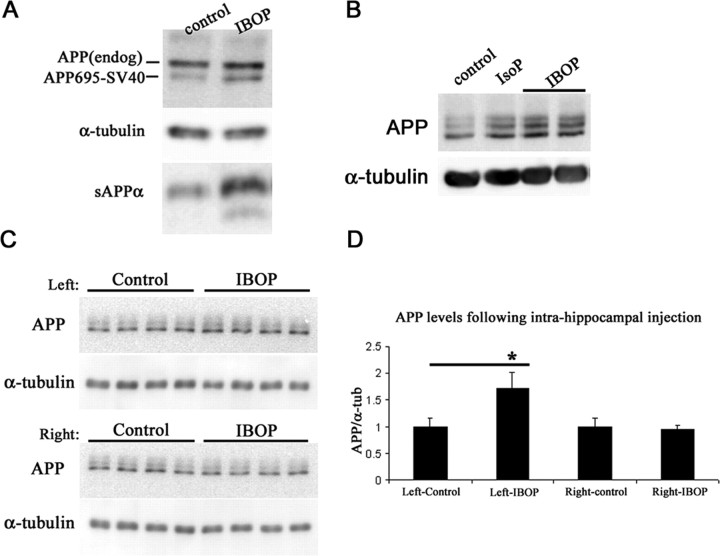
Alzheimer's disease (AD) amyloid plaques are composed of amyloid-beta (Abeta) peptides produced from proteolytic cleavage of amyloid precursor protein (APP). Isoprostanes, markers of in vivo oxidative stress, are elevated in AD patients and in the Tg2576 mouse model of AD-like Abeta brain pathology. To determine whether isoprostanes increase Abeta production, we delivered isoprostane iPF(2alpha)-III into the brains of Tg2576 mice. Although treated mice showed increased brain Abeta levels and plaque-like deposits, this was blocked by a thromboxane (TP) receptor antagonist, suggesting that TP receptor activation mediates the effects of iPF(2alpha)-III on Abeta. This hypothesis was supported by cell culture studies that showed that TP receptor activation increased Abeta and secreted APP ectodomains. This increase was a result of increased APP mRNA stability leading to elevated APP mRNA and protein levels. The increased APP provides more substrate for alpha and beta secretase proteolytic cleavages, thereby increasing Abeta generation and amyloid plaque deposition. To test the effectiveness of targeting the TP receptor for AD therapy, Tg2576 mice underwent long-term treatment with S18886, an orally available TP receptor antagonist. S18886 treatment reduced amyloid plaques, insoluble Abeta, and APP levels, thereby implicating TP receptor signaling as a novel target for AD therapy.
Figures


Similar articles
-
Vascular endothelial growth factor (VEGF) affects processing of amyloid precursor protein and beta-amyloidogenesis in brain slice cultures derived from transgenic Tg2576 mouse brain.Int J Dev Neurosci. 2009 Oct;27(6):517-23. doi: 10.1016/j.ijdevneu.2009.06.011. Epub 2009 Jul 7. Int J Dev Neurosci. 2009. PMID: 19589380
-
Memantine reduces the production of amyloid-β peptides through modulation of amyloid precursor protein trafficking.Eur J Pharmacol. 2017 Mar 5;798:16-25. doi: 10.1016/j.ejphar.2017.02.001. Epub 2017 Feb 4. Eur J Pharmacol. 2017. PMID: 28167259
-
Deletion of M1 muscarinic acetylcholine receptors increases amyloid pathology in vitro and in vivo.J Neurosci. 2010 Mar 24;30(12):4190-6. doi: 10.1523/JNEUROSCI.6393-09.2010. J Neurosci. 2010. PMID: 20335454 Free PMC article.
-
Insulin receptor signaling mediates APP processing and β-amyloid accumulation without altering survival in a transgenic mouse model of Alzheimer's disease.Age (Dordr). 2013 Feb;35(1):83-101. doi: 10.1007/s11357-011-9333-2. Epub 2011 Nov 6. Age (Dordr). 2013. PMID: 22057897 Free PMC article.
-
Alzheimer's disease.Subcell Biochem. 2012;65:329-52. doi: 10.1007/978-94-007-5416-4_14. Subcell Biochem. 2012. PMID: 23225010 Review.
Cited by
-
Molecular Pathogenesis and Interventional Strategies for Alzheimer's Disease: Promises and Pitfalls.ACS Pharmacol Transl Sci. 2020 Mar 26;3(3):472-488. doi: 10.1021/acsptsci.9b00104. eCollection 2020 Jun 12. ACS Pharmacol Transl Sci. 2020. PMID: 32566913 Free PMC article. Review.
-
Aβ Peptide Originated from Platelets Promises New Strategy in Anti-Alzheimer's Drug Development.Biomed Res Int. 2017;2017:3948360. doi: 10.1155/2017/3948360. Epub 2017 Sep 5. Biomed Res Int. 2017. PMID: 29018812 Free PMC article. Review.
-
Clinical Utility of Plasma Lipid Peroxidation Biomarkers in Alzheimer's Disease Differential Diagnosis.Antioxidants (Basel). 2020 Jul 22;9(8):649. doi: 10.3390/antiox9080649. Antioxidants (Basel). 2020. PMID: 32707935 Free PMC article.
-
Potent, long-acting cyclopentane-1,3-Dione thromboxane (A2)-receptor antagonists.ACS Med Chem Lett. 2014 Jul 24;5(9):1015-20. doi: 10.1021/ml5002085. eCollection 2014 Sep 11. ACS Med Chem Lett. 2014. PMID: 25221659 Free PMC article.
-
Cyclopentane-1,3-dione: a novel isostere for the carboxylic acid functional group. Application to the design of potent thromboxane (A2) receptor antagonists.J Med Chem. 2011 Oct 13;54(19):6969-83. doi: 10.1021/jm200980u. Epub 2011 Sep 9. J Med Chem. 2011. PMID: 21863799 Free PMC article.
References
-
- Audoly LP, Rocca B, Fabre JE, Koller BH, Thomas D, Loeb AL, Coffman TM, FitzGerald GA. Cardiovascular responses to the isoprostanes iPF(2alpha)-III and iPE(2)-III are mediated via the thromboxane A(2) receptor in vivo. Circulation. 2000;101:2833–2840. - PubMed
-
- Banker G, Goslin K, editors. Culturing nerve cells. Cambridge, MA: MIT; 1998. pp. 352–356.
-
- Beyreuther K, Pollwein P, Multhaup G, Monning U, Konig G, Dyrks T, Schubert W, Masters CL. Regulation and expression of the Alzheimer's beta/A4 amyloid protein precursor in health, disease, and Down's syndrome. Ann NY Acad Sci. 1993;695:91–102. - PubMed
-
- Blackman SC, Dawson G, Antonakis K, Le Breton GC. The identification and characterization of oligodendrocyte thromboxane A2 receptors. J Biol Chem. 1998;273:475–483. - PubMed
-
- Borg C, Lim CT, Yeomans DC, Dieter JP, Komiotis D, Anderson EG, Le Breton GC. Purification of rat brain, rabbit aorta, and human platelet thromboxane A2/prostaglandin H2 receptors by immunoaffinity chromatography employing anti-peptide and anti-receptor antibodies. J Biol Chem. 1994;269:6109–6116. - PubMed
Publication types
MeSH terms
Substances
Grants and funding
LinkOut - more resources
Full Text Sources
Other Literature Sources