. 2008 Jul;19(7):2802-17.
doi: 10.1091/mbc.e08-02-0146. Epub 2008 Apr 30.

Dynamic movement of the calcium sensor STIM1 and the calcium channel Orai1 in activated T-cells: puncta and distal caps

Affiliations

Dynamic movement of the calcium sensor STIM1 and the calcium channel Orai1 in activated T-cells: puncta and distal caps

Valarie A Barr et al. Mol Biol Cell. 2008 Jul.

Abstract

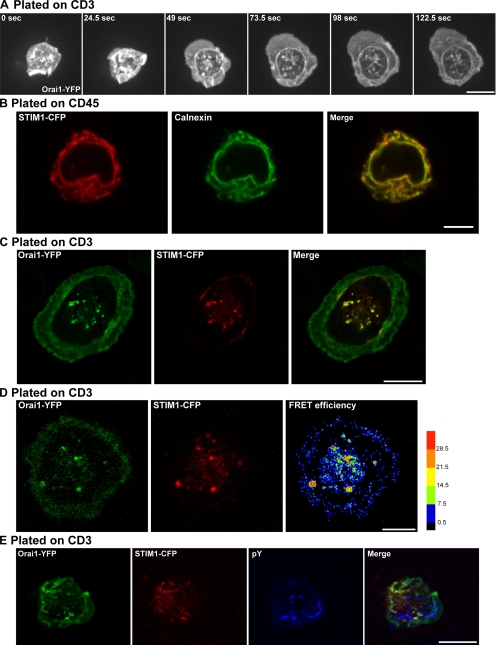
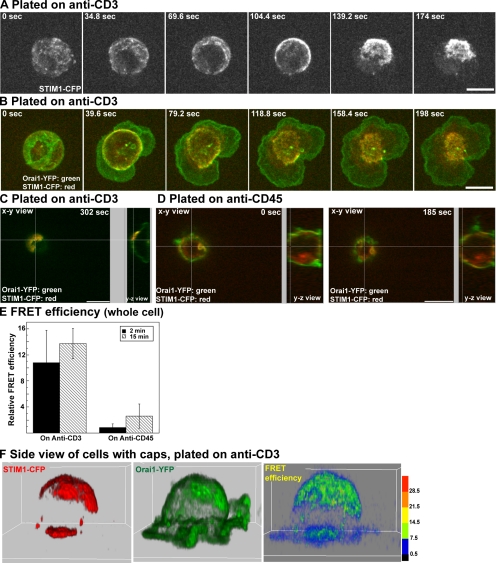
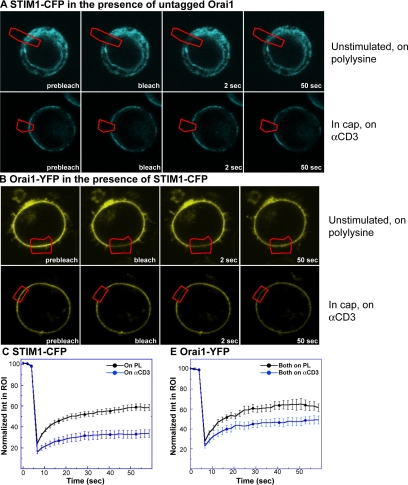
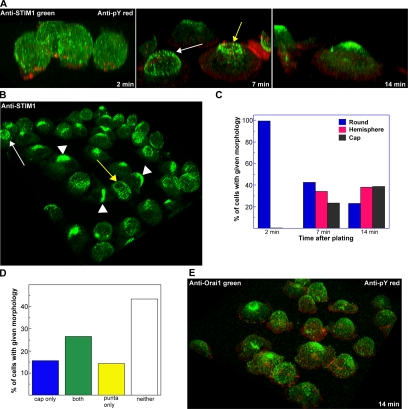
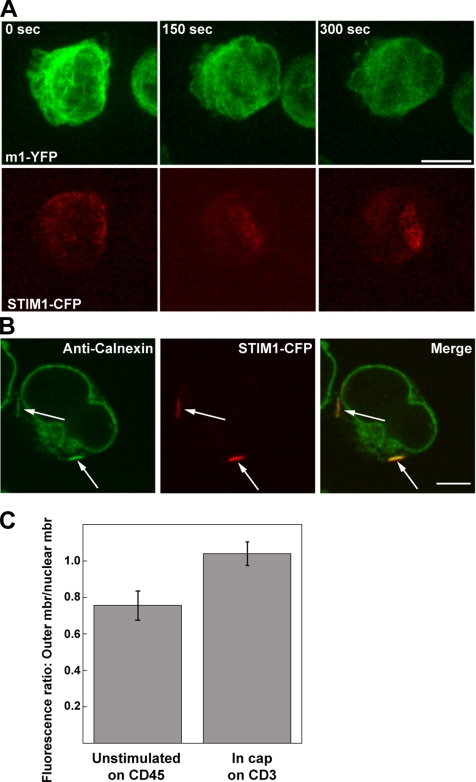
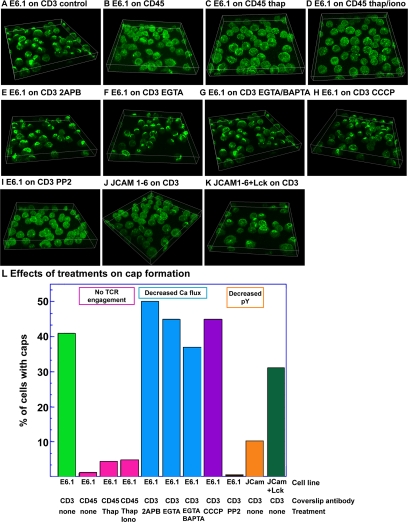
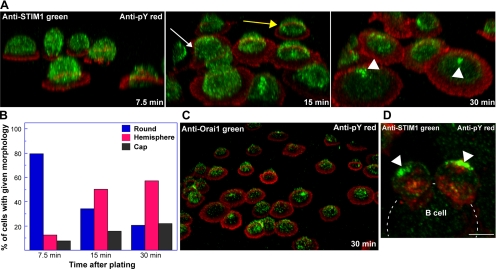
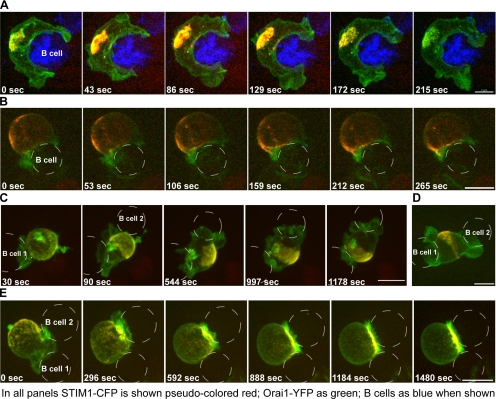
The proteins STIM1 and Orai1 are the long sought components of the store-operated channels required in T-cell activation. However, little is known about the interaction of these proteins in T-cells after engagement of the T-cell receptor. We found that T-cell receptor engagement caused STIM1 and Orai1 to colocalize in puncta near the site of stimulation and accumulate in a dense structure on the opposite side of the T-cell. FRET measurements showed a close interaction between STIM1 and Orai1 both in the puncta and in the dense cap-like structure. The formation of cap-like structures did not entail rearrangement of the entire endoplasmic reticulum. Cap formation depended on TCR engagement and tyrosine phosphorylation, but not on channel activity or Ca(2+) influx. These caps were very dynamic in T-cells activated by contact with superantigen pulsed B-cells and could move from the distal pole to an existing or a newly forming immunological synapse. One function of this cap may be to provide preassembled Ca(2+) channel components to existing and newly forming immunological synapses.


Figures

Figure 1.
Figure 1.
Orai1-YFP and STIM1-CFP puncta are induced by TCR activation in Jurkat T-cells. (A) A time series of E6.1 Jurkat T-cells expressing Orai1-YFP plated on anti-CD3–coated stimulatory coverslips and imaged with a spinning disk confocal system. A time series consists of Z stacks from selected time points displayed as maximum intensity projections. The 0 time point corresponds to the first image in the series, which is not necessarily the first contact with the coverslip. Bar, 10 μm. (B) Cells expressing STIM1-CFP (red) were plated on anti-CD45–coated nonstimulatory coverslips, fixed after incubation at 37°C for 2 min, and immunostained with anti-calnexin antibodies (green). Bar, 10 μm, confocal section ∼4 μm from bottom of cell. (C) Cells expressing Orai1-YFP (green) and STIM1-CFP (red) were plated on stimulatory coverslips and fixed after incubation at 37°C for 15 min. Bar, 10 μm, confocal section ∼1 μm from coverslip. Colocalized proteins in puncta appear yellow in the merged image (D) FRET analysis of Orai1-YFP (green) and STIM1-CFP (red) fixed 15 min after plating on a stimulatory coverslip. The right panel shows relative FRET efficiency values presented as a pseudocolor scale. Relative FRET efficiency is defined as the calculated FRET efficiency minus the average FRET efficiency of free CFP and YFP in Jurkat cells fixed and imaged at the same time as the experimental samples. Bar, 5 μm confocal section ∼1.5 μm from coverslip. (E) Cells expressing Orai1-YFP (green) and STIM1-CFP (red) were plated on a stimulatory coverslip, fixed after incubation at 37°C for 2 min, and immunostained with anti-phosphotyrosine antibodies (blue). Bar, 10 μm, confocal section ∼1 μm from coverslip.
Figure 2.
Figure 2.
STIM1-CFP and Orai1-YFP form caps after TCR activation. (A) A time series of an E6.1 Jurkat T-cell expressing STIM1-CFP plated onto a stimulatory coverslip and imaged with a spinning disk confocal system. Bar, 7 μm. (B) A time series of a cell expressing STIM1-CFP (red) and Orai1-YFP (green) plated onto a stimulatory coverslip. Bar, 7 μm. (C) 3D section view of a cell expressing STIM1-CFP (red) and Orai1-YFP (green) plated onto a stimulatory coverslip. A single confocal x-y slice is shown in the main view, and the y-z projection is displayed on the right side. The last time point with a well-developed cap is shown. Bar, 10 μm (D) 3D section view of a cell expressing STIM1-CFP (red) and Orai1-YFP (green) plated onto a nonstimulatory coverslip coated with anti-CD45 antibodies. A single confocal x-y slice is shown in the main view, and the y-z projection is displayed on the right side. The first and last time points are shown. Bar, 10 μm. (E) FRET efficiency values in cells fixed at 2 min and cells fixed at 15 min plated on stimulatory (anti-CD3: 2 min, n = 22; 15 min, n = 26) and nonstimulatory (anti-CD45; 2 min, n = 17; 15 min, n = 11) coverslips. Relative FRET efficiency for the cell is defined as the calculated FRET efficiency from the z-section showing the most FRET in a given cell minus the average FRET efficiency of CFP and YFP in Jurkat cells fixed and imaged at the same time as the experimental samples. (F) 3D projection of cells expressing Orai1-YFP (green) and STIM1-CFP (red) fixed 15 min after plating on a stimulatory coverslip. The right panel shows relative FRET efficiency values on a pseudocolor scale.
Figure 3.
Figure 3.
STIM1-CFP and Orai1-YFP show decreased mobility in caps. (A) FRAP of STIM1-CFP in unstimulated cells (top panels) or photobleaching of STIM1-CFP in a cap (bottom panels) in Jurkat T-cells expressing STIM1-CFP and untagged Orai1. Bleach region of interest (ROI) is shown in red. (B) FRAP of Orai1-YFP in unstimulated cells (top panels) or in a cap (bottom panels) in Jurkat T-cells expressing Orai1-YFP and STIM1-CFP. Bleach ROI is shown in red. (C) Average fluorescence recovery traces from photobleaching STIM1-CFP in cells expressing STIM1-CFP and untagged Orai1, on PL, n = 28, on anti-CD3, n = 21. Error bars, SEM. (D) Average fluorescence recovery traces from photobleaching Orai-YFP, on PL, n = 16, on anti-CD3, n = 18. Error bars, SEM.
Figure 4.
Figure 4.
Endogenous STIM1 and Orai1 form caps after TCR activation of Jurkat T-cells. (A) E6.1 Jurkat T-cells were plated on a stimulatory coverslip, fixed after incubation at 37°C for 2, 7, or 14 min, and immunostained with anti-STIM1 (green) and anti-phosphotyrosine (red) antibodies. 3D projections are shown. In the 2-min panel, the STIM1 staining shows a round pattern and in the 7-min panel there is a cell with a hemisphere of STIM1 staining (white arrow) and another cell with a STIM1 ring (yellow arrow), whereas in the 14-min panel, the cells have STIM1 caps. (B) 3D projection of cells stained with anti-STIM1 (green) fixed 14 min after plating onto a stimulatory coverslip. The white arrow indicates a cell with a ring, and the yellow arrow marks a cell with a hemisphere of STIM1 staining. Arrowheads show three cells with STIM1 caps. (C) Graph of the percentage of cells showing each kind of STIM1 staining pattern at the three time points. Cells that could not be clearly identified as having caps, hemispheres, or rings of STIM1 staining were counted as round cells. Number of cells counted: 2 min, n = 187; 7 min, n = 192; and 14 min, n = 244. (D) Distribution of cells with caps and puncta fixed 15 min after plating onto a stimulatory coverslip. Cells that could not be clearly identified as having caps or puncta near the cell surface, including cells with rings or hemispheres, were labeled as neither. Number of cells examined: n = 699. (E) 3D projection of cells stained with anti-Orai1 (green) and anti-phosphotyrosine (red) antibodies fixed 14 min after plating onto a stimulatory coverslip. Caps are marked with arrowheads.
Figure 5.
Figure 5.
The ER remains relatively unperturbed during cap formation. (A) Jurkat T-cells cells expressing STIM1-CFP (red) and M1-YFP (green) were plated onto a stimulatory coverslip and imaged with a spinning disk confocal system. Three time points are shown. Bar, 10 μm. (B) Cells expressing STIM1-CFP (red) were plated on coverslips, fixed after incubation at 37°C for 15 min, and immunostained with anti-calnexin antibodies (green). A single confocal slice at the bottom of a cap is shown. Arrows mark increased calnexin staining in the two parts of the cap that are visible. Bar, 10 μm, confocal section ∼4 μm from bottom of cell. (C) Quantification of calnexin redistribution. ROIs were drawn in the nuclear membrane and outer edge of the ER as marked by calnexin staining in unstimulated cells (n = 13) or in the nuclear membrane and cap in stimulated cells (n = 19). In unstimulated cells, the brightest calnexin staining is in the nuclear membrane, whereas in stimulated cells, the staining intensity in caps is as bright as the nuclear membrane.
Figure 6.
Figure 6.
Cap formation requires TCR engagement and tyrosine phosphorylation but not channel activity or Ca2+ flux. Jurkat T-cells were plated onto coverslips, fixed after 15 min at 37°C, and immunostained with affinity-purified anti-STIM1 antibodies. A tilted view of a 3D projection of a field of cells is shown. (A) E6.1 cells on stimulatory anti-CD3 coverslips. (B) E6.1 cells on nonstimulatory anti-CD45 coverslips. (C) Two minutes after plating on nonstimulatory anti-CD45 coverslips, 1 μM thapsigargin was added to E6.1 cells. Cells were fixed 15 min later. (D) Two minutes after plating on anti-CD45 coverslips, 1 μM thapsigargin and 5 μg/ml ionomycin were added to E6.1 cells. Cells were fixed 15 min later. (E) E6.1 cells were pretreated with 50 μM 2-APB for 5 min and then plated onto anti-CD3 coverslips in the presence of 2-APB. (F) E6.1 cells were plated onto anti-CD3 coverslips in buffer containing 10 mM EGTA. (G) E6.1 cells were pretreated with 50 μM BAPTA-AM for 20 min and then plated onto anti-CD3 coverslips in buffer containing EGTA. (H) E6.1 cells were pretreated with 10 μM CCCP for 1 min and then plated onto anti-CD3 coverslips in the presence of 10 μM CCCP. (I) E6.1 cells were pretreated with 10 μM PP2 for 30 min and then plated onto anti-CD3 coverslips in the presence of PP2. (J) Lck-deficient JCaM1.6 Jurkat cells on anti-CD3 coverslips. (K) Lck-deficient JCaM1.6 Jurkat cells reconstituted with WT Lck on anti-CD3 coverslips. (J) Graph of the percentage of cells with caps after each treatment. Number of cells counted: control E6.1 cells on CD3, n = 699; E6.1 cells on CD45, n = 552; E6.1 cells on CD45 + thapsigargin, n = 487; E6.1 cells on CD45 + thapsigargin + ionomycin, n = 550; 2-APB–treated E6.1 cells on CD3, n = 489; EGTA-treated E6.1 cells on CD3, n = 362; EGTA+BAPTA–treated E6.1 cells on CD3, n = 327; CCCP-treated E6.1 cells on CD3, n = 445; PP2-treated E6.1 cells on CD3, n = 356; JCaM1.6 cells on CD3, n = 340; and Lck-reconstituted JCaM1.6 cells on CD3, n = 259.
Figure 7.
Figure 7.
Caps of endogenous STIM1 and Orai1 form in human PLBs and mouse CD4 T-cells. (A) Human PBLs were plated on a stimulatory coverslip, fixed after incubation at 37°C for 7.5, 15, or 30 min, and immunostained with anti-STIM1 (green) and anti-phosphotyrosine (red) antibodies. 3D projections are shown. (B) Graph of the percentage of cells showing either round, ring/hemisphere or caps of STIM1 staining at the three time points. Number of cells counted: 7.5 min, n = 370; 15 min, n = 412, and 30 min, n = 451. (C) 3D projection of cells stained with anti-Orai1 (green) and anti-phosphotyrosine (red) antibodies fixed 30 min after plating onto a stimulatory coverslip. (D) Two mouse T-cells from AND TCR transgenic mice in contact with a peptide pulsed B-cell, fixed and immunostained with anti-STIM1 (green) and anti-phosphotyrosine (red) antibodies. Caps are indicated with arrowheads. Bar, 4 μm.
Figure 8.
Figure 8.
Dynamic caps in Jurkat T-cells activated by contact with superantigen-pulsed B-cells. Raji B-cells were pulsed with 1–2 μg/ml SEE toxin and were allowed to attach to polylysine-coated coverslips. E6.1 Jurkat T-cells expressing STIM1-CFP (red) and Orai-YFP (green) were added to the chamber and imaged with a spinning disk confocal system. The 0 time point corresponds to the first image in the series. Bar, 10 μm in all images. (A) Jurkat T-cell with prominent cap in contact with a B-cell. The B-cell (blue) has been visualized with CellTracker FarRed. (B) Jurkat T-cell in contact with a B-cell as the cap-like structure moves back to the contact site between the two cells. The B-cell was not stained. (C) Jurkat T-cell in contact with two B-cells as the cap forms oriented distal to the second B-cell. The B-cell channel is not shown. (D) Jurkat T-cell in contact with two B-cells with an accumulation of STIM1-CFP and Orai1-YFP between the two B-cells. The B-cells were not stained. (E) Jurkat T-cell in contact with two B-cells as the cap moves to the contact site with the second B-cell. The B-cell channel is not shown.

Similar articles

Cited by

References

    1. Baba Y., et al. Coupling of STIM1 to store-operated Ca2+ entry through its constitutive and inducible movement in the endoplasmic reticulum. Proc. Natl. Acad. Sci. USA. 2006;103:16704–16709. - PMC - PubMed
    1. Barr V. A., et al. T-cell antigen receptor-induced signaling complexes: internalization via a cholesterol-dependent endocytic pathway. Traffic. 2006;7:1143–1162. - PubMed
    1. Brandizzi F., Snapp E. L., Roberts A. G., Lippincott-Schwartz J., Hawes C. Membrane protein transport between the endoplasmic reticulum and the Golgi in tobacco leaves is energy dependent but cytoskeleton independent: evidence from selective photobleaching. Plant Cell. 2002;14:1293–1309. - PMC - PubMed
    1. Bunnell S. C., Barr V. A., Fuller C. L., Samelson L. E. High-resolution multicolor imaging of dynamic signaling complexes in T cells stimulated by planar substrates. Sci STKE. 2003;2003:PL8. - PubMed
    1. Bunnell S. C., Hong D. I., Kardon J. R., Yamazaki T., McGlade C. J., Barr V. A., Samelson L. E. T cell receptor ligation induces the formation of dynamically regulated signaling assemblies. J. Cell Biol. 2002;158:1263–1275. - PMC - PubMed

Publication types

LinkOut - more resources