. 2008 Jun 27;283(26):18135-46.
doi: 10.1074/jbc.M709735200. Epub 2008 May 1.

Protein phosphatase-1 inhibitor-3 is an in vivo target of caspase-3 and participates in the apoptotic response

Affiliations

Protein phosphatase-1 inhibitor-3 is an in vivo target of caspase-3 and participates in the apoptotic response

Hua-Shan Huang et al. J Biol Chem. .

Abstract

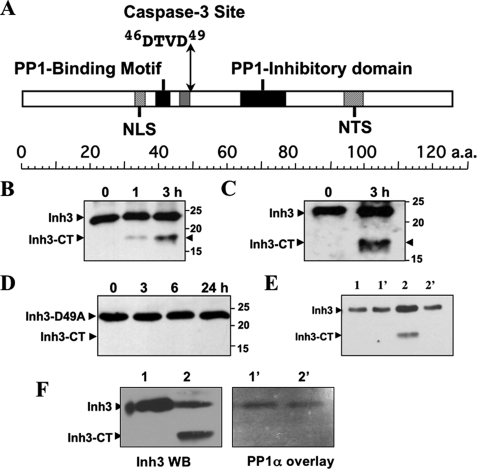
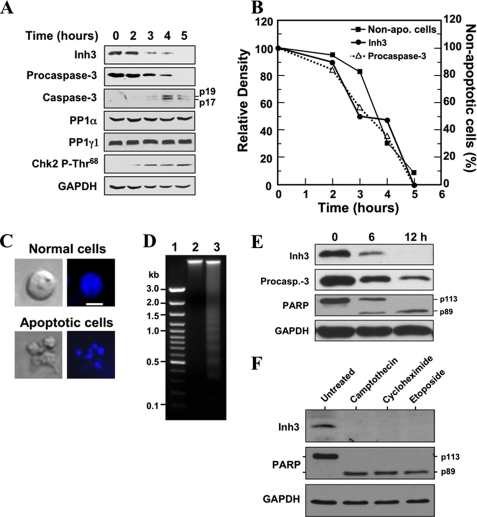
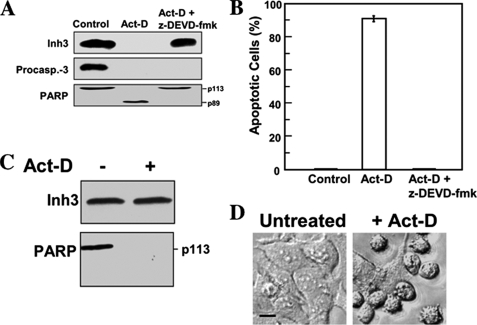
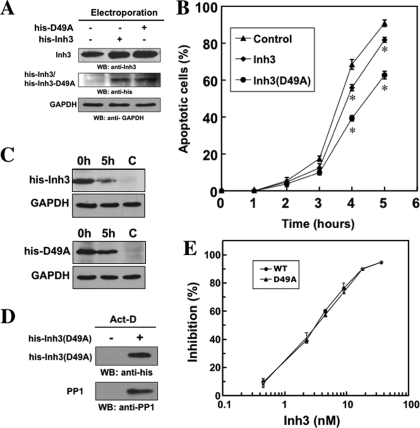
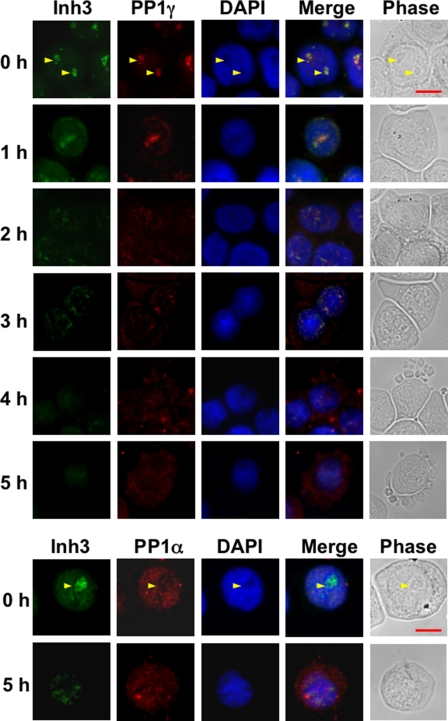
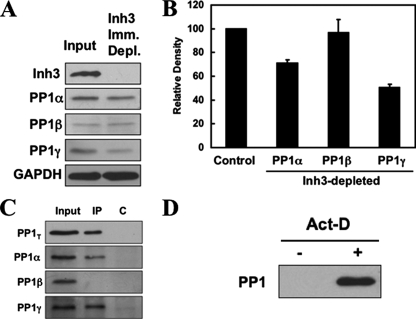
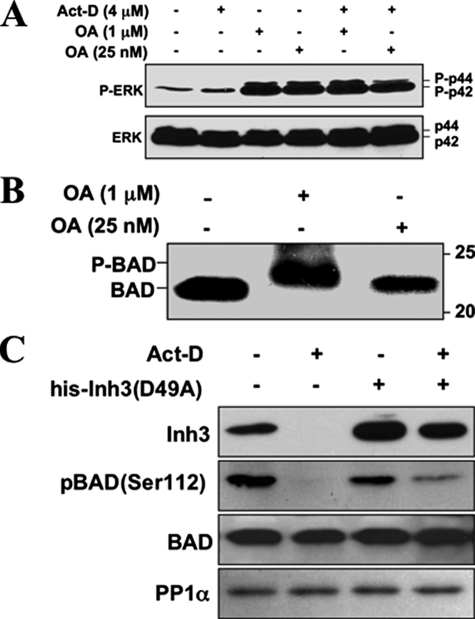
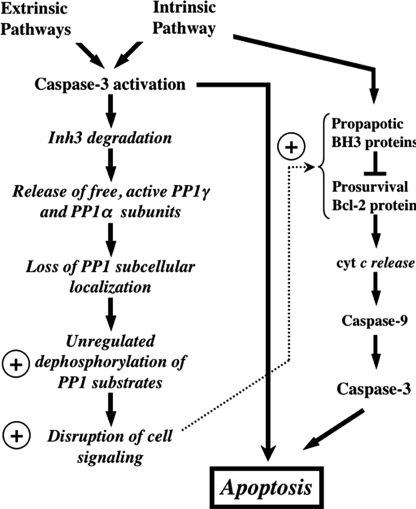
Inh3 (inhibitor-3) is a potent inhibitor of protein phosphatase-1 that selectively associates with PP1gamma1 and PP1alpha but not the PP1beta isoform. We demonstrate that Inh3 is a novel substrate for caspase-3 and is degraded in vivo during apoptosis induced by actinomycin D. Inh3 was not degraded in apoptotic MCF-7 cells, which lack caspase-3. These experiments establish that Inh3 is a novel physiological substrate of caspase-3. Electroporation of the caspase-3-resistant Inh3-D49A mutant into HL-60 cells resulted in a significant attenuation of apoptosis induced by actinomycin D. These results show that Inh3 degradation contributes to the apoptotic process. Immunofluorescence based examination of the subcellular localizations of Inh3 and PP1gamma1 revealed a major relocalization of the cellular pool of PP1gamma1 from the nucleolus to the nucleus and then to the cytoplasm during actinomycin D-induced apoptosis. A similar redistribution of PP1alpha from the nucleus to the cytoplasm occurred. These results are consistent with an unexpected discovery that significant fractions of the cellular pools of PP1gamma1 and PP1alpha are associated with Inh3 in HL-60 cells. Thus, Inh3 is a major factor in the cellular economy of PP1gamma1 and PP1alpha subunits. The unscheduled relocalization of this large a pool of PP1 subunits and their release from a potent inhibitor could deregulate a diverse range of essential cellular processes and signaling pathways. We discuss the significance of these findings in relation to working hypotheses whereby Inh3 destruction could contribute to the apoptotic process.


Figures

FIGURE 1.
FIGURE 1.
Inhibitor-3 is cleaved by caspase-3 in vitro at a DTVD cleavage site. A, domain map of human Inh3. The diagram shows the location of the putative caspase-3 cleavage site (46DTVD49), the nuclear localization signal (NLS), the nucleolar targeting signal (NTS) (19), the PP1 binding motif (39KKVEW43) (18), and the inhibitory domain that lies between residues 64 and 77. B, in vitro cleavage of Inh3 by caspase-3. Purified recombinant His6-Inh3 was incubated with recombinant human caspase-3 for the indicated times and Western blotted with a rabbit polyclonal antibody against Inh3 (see “Experimental Procedures”). Inh3-CT is the 17.5-kDa cleavage product. C, purified recombinant Inh3 was treated with caspase-3 as in B, except that a peptide-specific antibody to amino acids 69–83 of Inh3 was used. D, mutation of the caspase-3 site in Inh3 renders it resistant to cleavage. Recombinant Inh3(D49A) was treated with caspase-3 as in B, and the digests were analyzed by Western blotting with a polyclonal antibody against Inh3. One representative experiment of three is shown in A–D. E, the Inh3-CT cleavage product does not immunoprecipitate with PP1. Purified Inh3 or Inh3 predigested with caspase-3 was incubated with PP1α for 1 h at 4 °C, immunoprecipitated with PP1α antibody, and Western blotted with anti-Inh3 antibody (see “Experimental Procedures”). Lane 1, Inh3 input; lane 1′, immunoprecipitate of PP1α plus Inh3; lane 2, caspase-3-cleaved Inh3 input; lane 2′, immunoprecipitate of PP1α plus caspase-3-cleaved Inh3. F, overlay assay. Left, Western blot of Inh3 and caspase-3-treated Inh3 with Inh3 antibody. Lane 1, Inh3; lane 2, caspase-3-cleaved Inh3. Right, overlay blot of Inh3 and caspase-3-treated Inh3 with PP1. Lanes 1′ and 2′ correspond to lanes 1 and 2 in the left panel. The membranes were blocked with 5% nonfat milk proteins and then incubated with purified PP1α. The membrane was washed and then probed with anti-PP1 antibody (see “Experimental Procedures”). Essentially identical results were obtained in two independent experiments for the data shown in E and F. a.a., amino acids; WB, Western blot.
FIGURE 2.
FIGURE 2.
Inh3 is degraded during act-D-induced apoptosis in HL-60 cells in parallel with the activation of caspase-3. A, HL-60 cells were incubated with 4 μm act-D for the indicated times; cell lysates were prepared and subjected to Western blot analysis using the indicated antibodies. GAPDH was used as a protein loading control in the Western blots. B, the levels of Inh3 (solid circles) and procaspase-3 (open triangles) in the blots in A were quantified via densitometry and plotted against time. The percentage of apoptotic cells and nonapoptotic cells at each time point was determined by Hoechst staining (see “Experimental Procedures”). The data were plotted as percentage of nonapoptotic cells (solid squares). C, Hoechst 33258 staining of cells. The apoptotic cells exhibited irregular Hoechst nuclear staining with multiple bright specks of chromatin fragmentation and condensation. Normal cells were considered to have Hoechst-stained smooth nuclear regions. The images on the left are those obtained by light microscopy, and the images on the right were obtained by fluorescence microscopy. The white bar in the top right image is the scale for 10 μm. D, DNA fragmentation pattern of act-D-treated cells. HL-60 cells were untreated (lane 2) or treated with act-D for 5 h (lane 3). DNA was extracted and analyzed on 1.5% agarose gel electrophoresis after ethidium bromide staining. Lane 1, marker DNA. E, Inh3 is degraded in parallel with PARP during act-D-induced apoptosis. MOLT-4 cells were treated with 4 μm act-D for the indicated times. The cells were lysed and Western blotted for Inh3, caspase-3, PARP, and GAPDH. F, Inh3 degradation occurs during apoptosis induced by camptothecin, cycloheximide, or etoposide. HL-60 cells were treated with 10 μm camptothecin, 250 μm cycloheximide, or 250 μm etoposide for 5 h. The cells were then lysed and Western blotted for Inh3, PARP, and GAPDH. One representative experiment of three is shown.
FIGURE 3.
FIGURE 3.
Inh3 is not degraded during act-D-induced apoptosis in the presence of the caspase inhibitor, Z-DEVD-fmk, or in a caspase-3-deficient cell line. A, HL-60 cells were incubated with or without caspase inhibitor (Z-DEVD-fmk; 100 μm) for 1 h and then treated with 4 μm act-D for an additional 5 h to induce apoptosis. Cell lysates were subjected to Western blot analysis using antibodies against Inh3, caspase-3, and PARP. B, the percentage of apoptotic cells was determined by the Hoechst assay (see “Experimental Procedures”). The error bar indicates the mean ± S.D. (n = 3). C, MCF-7 cells, which lack caspase-3, were treated with 16 μm act-D for 24 h. Rounded and detached cells were collected, lysed, and Western blotted for Inh3 and PARP. D, phase-contrast microscopy of MCF-7 cells treated as in C, showing the morphological differences between untreated and act-D-treated cells. Phase images were obtained using a Zeiss Axioplan 2 fluorescence microscope with a ×20 objective (see “Experimental Procedures”). Scale bar (black horizontal bar in the left image), 10 μm.
FIGURE 4.
FIGURE 4.
Introduction of the caspase-3 resistant Inh3(D49A) mutant into HL-60 cells by electroporation attenuates act-D-induced apoptosis. Purified recombinant His-Inh3(D49A) or His-Inh3 was introduced into HL-60 cells by electroporation (see “Experimental Procedures”). A, the uptake of electroporated His-Inh3 or His-Inh3(D49A) was monitored by Western blot analysis with an anti-Inh3 antibody. The relative densities of the blots were determined to be 1:1.5:1.8 for the control cells, cells electroporated with His-Inh3, and cells electroporated with His-Inh3(D49A), respectively. The center panel shows the same membrane from the upper panel after stripping and Western blotting (WB) with anti-polyhistidine antibody. GAPDH was used as the loading control. B, mock-electroporated cells (solid triangles) and cells electroporated with His-Inh3 (solid diamonds) or His-Inh3(D49A) (solid circles) were treated with act-D (4 μm) for 1–5 h. The percentage of apoptotic cells was determined by Hoechst staining (see “Experimental Procedures”). Data are presented as mean ± S.D. from three independent experiments conducted in parallel (*, p < 0.005 comparing control and Inh3(D49A) or Inh3). C, HL-60 cells electroporated with His-Inh3 or His-Inh3(D49A), as indicated, were untreated (0 h) or treated with act-D (4 μm) for 5 h. Cell lysates were analyzed by immunoblotting using anti-polyhistidine antibody. C, mock-electroporated cells. D, pull-down assay for binding of PP1 to His-Inh3(D49A). His-Inh3(D49A) was electroporated into HL-60 cells. After act-D treatment for 5 h, cell lysates were pulled down with TALON metal affinity resin and subjected to immunoblotting using anti-polyhistidine (top) and anti-PP1 (bottom) (see “Experimental Procedures”). Left lane, apoptotic mock-electroporated cells; right lane, apoptotic cells electroporated with His-Inh3(D49A). The results shown were representative of three independent experiments. E, the D49A mutation of Inh3 does not affect its ability to inhibit PP1 activity. Purified recombinant His-tagged Inh3 (solid circles) and Inh3(D49A) (solid triangles) were assayed for the inhibition of PP1α activity measured using 32P-labeled muscle phosphorylase a as the substrate. Data are shown as the mean ± S.D. (n = 3) (see “Experimental Procedures”).
FIGURE 5.
FIGURE 5.
Subcellular localization of Inh3, PP1α, and PP1γ1 in normal and apoptotic HL-60 cells. HL-60 cells were untreated or treated with 4 μm act-D for the times indicated. Cells were cytocentrifuged, fixed, permeabilized, and immunostained as described under “Experimental Procedures.” Top, cells were double-stained for Inh3 (green fluorescence) and for PP1γ1(red fluorescence). Bottom, HL-60 cells were untreated or treated with 4 μm act-D for 5 h. Cells were cytocentrifuged, fixed, permeabilized, and immunostained for Inh3 (green fluorescence) and for PP1α (red fluorescence). Fluorescence images were obtained using an Axioplan 2 fluorescence microscope with a ×40 objective. The yellow arrows in the 0 h rows show the nucleoli. Scale bar (shown by the red horizontal bar in the phase image in the upper right panel), 10 μm. DAPI, 4′,6-diamidino-2-phenylindole.
FIGURE 6.
FIGURE 6.
Inh3 is associated with significant fractions of the PP1α and PP1γ1 isoforms in HL-60 cells. HL-60 cell lysates were immunoprecipitated with a polyclonal antibody against Inh3 using amounts of antibody that were predetermined to be sufficient to immunodeplete the lysates (see “Experimental Procedures”). A, the Inh3-immunodepleted supernatants were Western blotted with antibodies against Inh3 and with isoform-specific antibodies against PP1α, PP1β, or PP1γ1, as indicated. GAPDH was used as a loading control. B, the amounts of PP1α, PP1β, and PP1γ1 remaining in the Inh3-depleted supernatants relative to the input (Control) were determined by densitometric analysis (see “Experimental Procedures”) and shown as a bar diagram. The data are presented as mean ± S.D. (n = 3). C, the immunoprecipitates (IP) from the experiment shown in A were immunoblotted with a non-isoform-specific antibody against PP1 (shown as PP1T) or with isoform-specific antibodies against PP1α, PP1β, or PP1γ1. The lanes shown are the input, the immunoprecipitate (IP), and the immunoprecipitation performed with normal rabbit IgG (lane C). D, pull-down assays of untreated and act-D-treated HL-60 lysates for free PP1. HL-60 cells were treated with 4 μm act-D for 5 h. Cell lysates were pulled down using TALON metal affinity beads that were presaturated with His-Inh3. The bound proteins were extracted with loading buffer and subjected to SDS-PAGE and immunoblotted with antibody against PP1 (non-isoform-specific).
FIGURE 7.
FIGURE 7.
PP1 activity is involved in the dephosphorylation of BAD, and BAD dephosphorylation during act-D-induced apoptosis is inhibited by electroporation of Inh3(D49A). A, HL-60 cells were treated with 1 μm or 25 nm OA for 5 h, in the absence and presence of act-D (4 μm), as indicated. Cell lysates were Western blotted with a phosphospecific antibody for ERK (top), and with an antibody against ERK (bottom). B, HL-60 cells were treated with 1 μm or 25 nm OA for 5 h. Cells were then analyzed for BAD by Western blotting. The positions of phosphorylated (P-BAD) and nonphosphorylated BAD are indicated. Data for A and B are representative of three experiments. C, HL-60 cells were electroporated with or without purified His-Inh3(D49A) prior to treatment with act-D for 5 h or without act-D, as indicated. Cell lysates were Western blotted for Inh3, BAD-phosphoserine 112, BAD, and PP1α. The data are representative of three independent experiments.
FIGURE 8.
FIGURE 8.
Overview of the potential impact of caspase-3 degradation of Inh3 on cell functions. This diagram shows the potential impact of caspase-3 on Inh3 degradation within a simplified scheme of the apoptotic pathways. Since caspase-3 is a primary executioner caspase, Inh3 degradation is expected to accompany caspase-3-activated apoptotic signaling pathways whether these are generated through the intrinsic or extrinsic pathways. Inh3 is a potent PP1 inhibitor and controls a significant fraction of the cellular pool of PP1γ1 and PP1α. In addition, it also controls the subcellular localization of PP1γ1 to the nucleolus. Degradation of Inh3 leads to release of active PP1 catalytic subunits, which are no longer restrained to their normal subcellular compartments. As a consequence, unregulated dephosphorylation of PP1 substrates by the active PP1 catalytic subunits takes place, leading to disruption of cellular processes. The circled plus sign is used here to indicate a proapoptotic effect. Among the PP1 substrates are a subset of those that are involved in apoptotic signaling pathways. Their unregulated dephosphorylation might also affect apoptotic signaling. On the right side of the diagram is a simplified outline of the intrinsic pathway to indicate the interactions of the Bcl-2 and BH3 family of proteins, of which several, including Bcl-2 and BAD, have been reported to be regulated by protein phosphatase-1 activity. Unregulated dephosphorylation of these proteins could produce a proapoptotic signaling effect. This would provide a potential feedback mechanism that is shown by the dotted arrow.

References

    1. Ceulemans, H., and Bollen, M. (2004) Physiol. Rev. 84 1-39 - PubMed
    1. Cohen, P. (1989) Annu. Rev. Biochem. 58 453-508 - PubMed
    1. Lee, E. Y., Zhang, L., Zhao, S., Wei, Q., Zhang, J., Qi, Z. Q., and Belmonte, E. R. (1999) Front. Biosci. 4 D270-D285 - PubMed
    1. Shima, H., Hatano, Y., Chun, Y. S., Sugimura, T., Zhang, Z., Lee, E. Y., and Nagao, M. (1993) Biochem. Biophys. Res. Commun. 192 1289-1296 - PubMed
    1. Egloff, M. P., Johnson, D. F., Moorhead, G., Cohen, P. T., Cohen, P., and Barford, D. (1997) EMBO J. 16 1876-1887 - PMC - PubMed

Publication types