. 2008 Aug 1;283(31):21519-29.
doi: 10.1074/jbc.M709190200. Epub 2008 May 1.

Constitutive activation of the N-methyl-D-aspartate receptor via cleft-spanning disulfide bonds

Affiliations

Constitutive activation of the N-methyl-D-aspartate receptor via cleft-spanning disulfide bonds

Marie L Blanke et al. J Biol Chem. .

Abstract

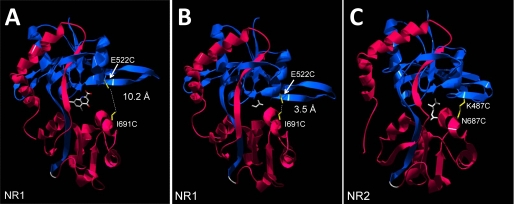
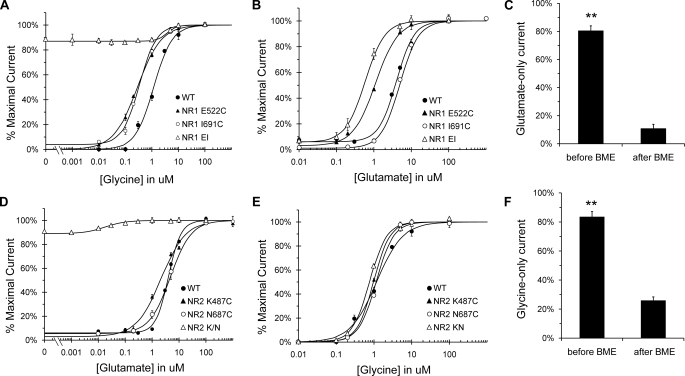
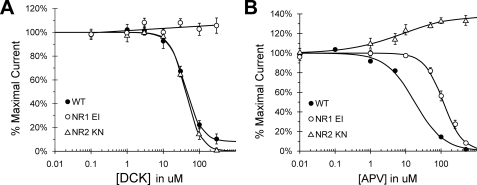
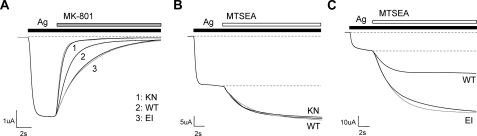
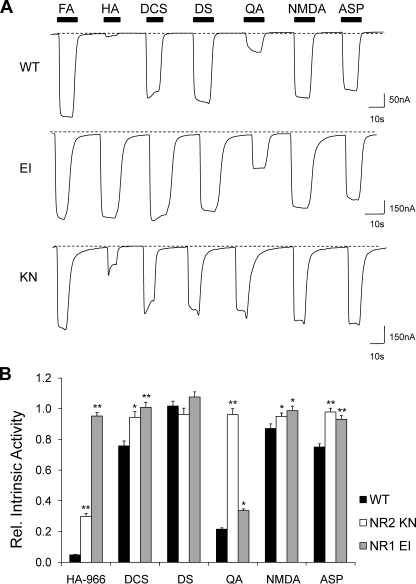
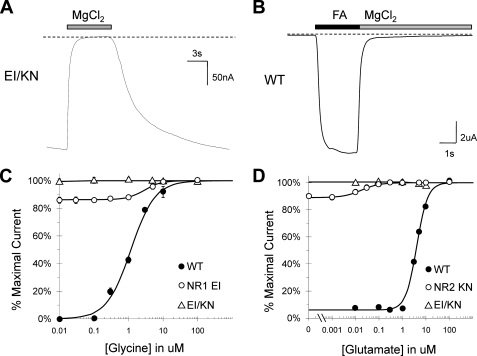
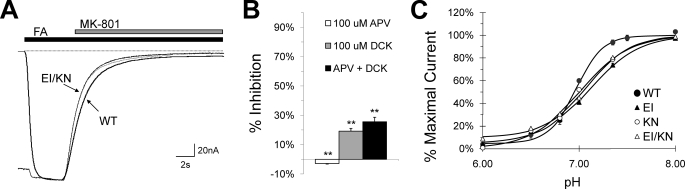
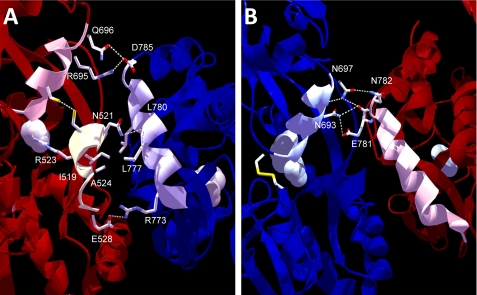
Although the N-methyl-D-aspartate (NMDA) receptor plays a critical role in the central nervous system, many questions remain regarding the relationship between its structure and functional properties. In particular, the involvement of ligand-binding domain closure in determining agonist efficacy, which has been reported in other glutamate receptor subtypes, remains unresolved. To address this question, we designed dual cysteine point mutations spanning the NR1 and NR2 ligand-binding clefts, aiming to stabilize these domains in closed cleft conformations. Two mutants, E522C/I691C in NR1 (EI) and K487C/N687C in NR2 (KN) were found to exhibit significant glycine- and glutamate-independent activation, respectively, and co-expression of the two subunits produced a constitutively active channel. However, both individual mutants could be activated above constitutive levels in a concentration-dependent manner, indicating that cleft closure does not completely prevent agonist association. Interestingly, whereas the NR2 KN disulfide was found to potentiate channel gating and M3 accessibility, NR1 EI exhibited the opposite phenotype, suggesting that the EI disulfide may trap the NR1 ligand-binding domain in a lower efficacy conformation. Furthermore, both mutants affected agonist sensitivity at the opposing subunit, suggesting that closed cleft stabilization may contribute to coupling between the subunits. These results support a correlation between cleft stability and receptor activation, providing compelling evidence for the Venus flytrap mechanism of glutamate receptor domain closure.


Figures

FIGURE 1.
FIGURE 1.
Design of the disulfide mutants. A, structure of the NR1 ligand-binding domain in its open cleft conformation, bound to competitive antagonist DCK. Cysteine substitutions at E522 and I691C, depicted in yellow, are separated by a distance of 10.20 Å. The S1 lobe is shown in blue, S2 in pink, and the GT linker in gray. B, structure of the NR1 ligand-binding domain bound to glycine, representing the closed cleft conformation. Domain closure decreases the distance between E522C and I691C to 3.5 Å. C, the closed cleft conformation of the NR2A ligand-binding domain, shown bound to glutamate. Cysteine substitutions were introduced at positions Lys487 and Asn687, as depicted in yellow, and separated by a distance of 3.3 Å. Measurements were made using Swiss PDB Viewer, based on accession codes 1PBQ, 1PB7, and 2A5S for A–C, respectively.
FIGURE 2.
FIGURE 2.
Agonist-independent activation of NR1 EI and NR2 KN. A, glycine concentration-response curves for NR1 mutants E522C, I691C, and EI in the presence of 100 μm l-glutamate. Glycine sensitivity was increased in all three mutants, but only the EI double mutant exhibited partial activation in the absence of glycine (87%, compared with 4% for E522C and 6% for I691C). B, glutamate concentration-response curves for NR1 E522C, I691C, and EI in the presence of 100 μm glycine. Glutamate sensitivity was increased in both E522C and EI (concentration midpoint = 1.11 and 0.58 μm, respectively, compared with 4.00 μm for wild type) but not I691C. Glutamate-independent current was not significantly different from wild type for any of the mutants. C, BME inhibition of EI glycine-independent response. The ratio of current elicited by 100 μm glutamate to current elicited by full agonist (100 μm glycine plus 100 μm glutamate) was compared before and after a 10-s application of 5% BME. BME treatment was sufficient to inhibit EI glutamate-only current by 70 ± 3%. D, glutamate concentration-response curves for NR2 K487C, N687C, and K487C/N687C (KN) in the presence of 100 μm glycine. K487C displayed a small increase in glutamate sensitivity (midpoint = 2.20 μm), whereas N687C was indistinguishable from wild type (midpoint = 4.00 μm). In contrast, the KN concentration-response curve was significantly left-shifted, exhibiting a concentration midpoint of 0.02 μm. The KN mutant also displayed a significant degree of activation in the absence of glutamate (90%, compared with 5% for either single mutant). E, glycine concentration-response curves for NR2 mutants K487C, N687C, and KN in the presence of 100 μm l-glutamate. K487C and KN displayed slightly increased glycine sensitivity, with the largest increase seen in KN (concentration midpoint = 0.76 μm compared with 1.16 for WT NR2). None of the mutants exhibited any glycine-independent current. F, BME inhibition of KN glutamate-independent response. Same as in C, except the ratio of glycine-only current to full agonist current was measured. BME treatment inhibited NR2 KN glycine-only current by 58 ± 4%.
FIGURE 3.
FIGURE 3.
Decreased antagonist sensitivity in NR1 EI and NR2 KN. A, DCK concentration-inhibition curves for EI and KN, determined in the presence of 100 μm glycine and 100 μm glutamate. The EI double mutant was completely insensitive to DCK inhibition, whereas the KN mutant was indistinguishable from wild type (midpoint = 41.24 μm). B, APV concentration-inhibition curves for EI and KN, also determined in the presence of 100 μm glycine and 100 μm glutamate. The EI curve was right-shifted relative to wild type (concentration midpoint = 115.96 μm compared with 17.96 μm for WT), whereas the KN mutant was completely insensitive to APV inhibition. In contrast, APV treatment activated KN receptors above the response elicited by full agonist, resulting in a 33% potentiation.
FIGURE 4.
FIGURE 4.
Effect of EI and KN mutations on MK-801 block rate and MTSEA potentiation. A, representative whole cell traces illustrating block by 200 nm MK-801, applied in the presence of 20 μm glycine and/or 100 μm glutamate. MK-801 block rates were fitted with first-order exponential functions using the Clampfit module of pCLAMP 9.0. For NR1 EI receptors, the time course of MK-801 inhibition was 2.21-fold slower than WT (with glycine) and 2.82-fold slower (without glycine). NR2 KN receptors, in comparison, were blocked 2.06-fold faster (with glutamate) and 2.05-fold faster (without glutamate). Each mutant trace is numbered, as indicated, and application of agonist (Ag) and MK-801 are depicted by black and gray bars, respectively. The gray traces illustrate block of EI with glutamate only and KN with glycine only. Maximum responses for each trace were normalized to illustrate kinetic differences. B, representative traces depicting MTSEA potentiation of NR2 KN and NR2 WT receptors, co-expressed with the NR1-A7C reporter construct. Currents were elicited with 20 μm glycine and 100 μm glutamate or 20 μm glycine, indicated by the black bar (agonis). Potentiation by 0.5 mm MTSEA (white bar) was not significantly different between WT (1.61-fold) and KN-containing receptors (1.61-fold with glutamate, 1.56-fold without glutamate). KN in the absence of glutamate is represented by a gray trace. In both B and C, maximum current responses were normalized to illustrate differences in degree of potentiation, and dashed gray lines depict normalized response levels in the presence and absence of full agonist. C, MTSEA potentiation of NR1 EI and NR1 WT receptors, co-expressed with the NR2-A7C reporter construct. Currents were elicited with 20 μm glycine and 100 μm glutamate or with 100 μm glutamate (Ag, black bar), and EI in the absence of glycine is represented by a gray trace. The addition of 0.5 mm MTSEA, depicted with a white bar, modified and potentiated EI-containing receptors 4.85-fold (with glycine) and 5.25-fold (without glycine), compared with 2.73-fold for WT.
FIGURE 5.
FIGURE 5.
Altered relative efficacy of NR1 and NR2 site partial agonists. A, representative whole cell traces illustrating the response of NR1 EI and NR2 KN to three NR1 agonists (HA-966, DCS, and d-serine) and three NR2 agonists (quinolinic acid, NMDA, and l-aspartate). Agonist concentrations were as follows: 500 μm HA-966 (HA), 1 mm DCS, 100 μm d-serine (DS), 10 mm quinolinic acid (QA), 1 mm NMDA, and 100 μm l-aspartate (ASP). Each agonist was co-applied with a 100 μm concentration of the appropriate co-agonist. Maximal current responses are normalized to facilitate comparison. B, bar graph illustrating the changes in intrinsic activity for each mutant, relative to glutamate. NR1 EI can distinguish partial agonism at the glutamate site but not the glycine site, whereas NR2 displays the opposite phenotype. Increased responses were seen with all partial agonists at both mutants. Statistical significance was determined for each mutant relative to wild type. * and **, p < 0.05 and p < 0.01, respectively. Normalized current responses for NR1 EI were as follows, expressed as mean ± S.E.: HA-966 = 0.95 ± 0.02 (n = 6), DCS = 1.01 ± 0.03 (n = 6), d-serine = 1.08 ± 0.03 (n = 6), quinolinic acid = 0.34 ± 0.01 (n = 6), NMDA = 0.99 ± 0.03 (n = 6), l-aspartate = 0.93 ± 0.02 (n = 6). Normalized current responses for NR2 KN were as follows: HA-966 = 0.30 ± 0.02 (n = 15), DCS = 0.94 ± 0.04 (n = 13), d-serine = 0.96 ± 0.04 (n = 12), quinolinic acid = 0.96 ± 0.04 (n = 12), NMDA = 0.95 ± 0.02 (n = 8), l-aspartate = 0.98 ± 0.02 (n = 7).
FIGURE 6.
FIGURE 6.
Co-expression of NR1 EI and NR2 KN yields a constitutively active channel. A, representative whole-cell trace illustrating the response of EI/KN to Mg2+ block, showing activation of EI/KN by depolarization alone (-60 mV) in the absence of glycine or glutamate. Treatment with 10 mm MgCl2, depicted with a gray bar, inhibits the constitutive response. B, whole cell trace showing WT receptors activated by 100 μm glycine and 100 μm glutamate (black bar) and subsequently blocked with 10 mm MgCl2 (gray bar), indicating that Mg2+ completely blocks WT receptors back to base-line levels. Therefore, Mg2+ block was used at the end of each experiment in C and D to provide a base-line current level. C, concentration-response curve for glycine in the presence of 100 μm glutamate, showing very little glycine-dependent activation. A linear fit to the data points yielded a Y0 of 0.99. D, concentration-response curve for glutamate in the presence of 100 μm glycine, showing no visible glutamate-dependent activation. The Y0 value obtained from a linear fit was 1.00.
FIGURE 7.
FIGURE 7.
Inhibition of EI/KN receptors. A, representative trace illustrating block by 200 nm MK-801, performed as in Fig. 4A. The average rate of block (in s-1) for EI/KN receptors was 0.71 ± 0.05 in the presence of 20 μm glycine and 100 μm glutamate and 0.70 ± 0.06 in the absence of agonist, compared with 0.62 ± 0.05 for WT (see Table 2). Thus, these receptors are blocked only slightly faster than WT and very close to the average of the individual EI and KN mutants. B, bar graph showing inhibition by APV and DCK in the absence of agonist. 100 μm APV alone does not block, whereas 100 μm DCK reduces current by 19% ± 2%. Co-application of 100 μm APV and 100 μm DCK increases the degree of block to 26 ± 3%. The inhibition percentage differs significantly from 0 in all three cases, based on 99% confidence intervals (**). 10 mm Mg2+ block was used at the end of each experiment in B and C to provide a base-line current level. C, proton concentration-inhibition curves for EI/KN and both individual disulfide mutants. The concentration midpoint is relatively unaffected (7.09 for EI/KN, 7.11 for EI, and 7.01 for KN, compared with 6.97 for WT), but all three mutations exhibit a decreased Hill slope. Fitted nH values were as follows: WT = 3.15, EI/KN = 1.95, EI = 1.69, KN = 1.68.
FIGURE 8.
FIGURE 8.
Predicted interface interactions in the NR1 EI and NR2 KN heterodimer. A, interactions between the EI disulfide region and the NR2 subunit, based on the agonist-bound crystal structure of the NR1-NR2A heterodimer (accession number 2A5T). The NR1 and NR2 subunits are shown in dark red and dark blue, respectively, with NR1 helix F and two C-terminal residues highlighted in pink, helix D and the beginning of sheet 9 in yellow, and NR2 helix J in blue. Glycine and glutamate are shown as gray space-filling molecules. The EI disulfide spans the cleft between helix F and helix D of NR1, both of which are predicted to interact with helix J of the NR2 subunit. Residues shown at the interface are predicted to participate in hydrophobic interactions or hydrogen bonding (dashed lines) with the opposing subunit. Arg523, which is located immediately adjacent to E522C, forms an essential hydrogen bond with the α-carboxyl group of glycine. B, interactions between the KN disulfide regions and the NR1 subunit. The NR2 helix F is highlighted in light blue, and NR1 helix J is highlighted in pink. The KN disulfide spans the cleft between helix F and sheet 6, but only helix F appears to participate in intersubunit interactions. Residues predicted to interact with the NR1 subunit are shown at the interface between NR2 helix F and the C-terminal region of NR1 helix J. Notably fewer interactions are seen than in the EI disulfide dimer.

References

    1. Bashir, Z. I., Alford, S., Davies, S. N., Randall, A. D., and Collingridge, G. L. (1991) Nature 349 156-158 - PubMed
    1. Sheng, M., Cummings, J., Roldan, L. A., Jan, Y. N., and Jan, L. Y. (1994) Nature 368 144-147 - PubMed
    1. Kauer, J. A., Malenka, R. C., and Nicoll, R. A. (1988) Nature 334 250-252 - PubMed
    1. Emamian, E. S., Karayiorgou, M., and Gogos, J. A. (2004) J. Neurosci. 24 1561-1564 - PMC - PubMed
    1. Hynd, M. R., Scott, H. L., and Dodd, P. R. (2004) Neurochem. Int. 45 583-595 - PubMed

Publication types

LinkOut - more resources