. 2008 May 1;22(9):1174-89.
doi: 10.1101/gad.1642808.

The role of the chromatin remodeler Mi-2beta in hematopoietic stem cell self-renewal and multilineage differentiation

Affiliations

The role of the chromatin remodeler Mi-2beta in hematopoietic stem cell self-renewal and multilineage differentiation

Toshimi Yoshida et al. Genes Dev. .

Abstract

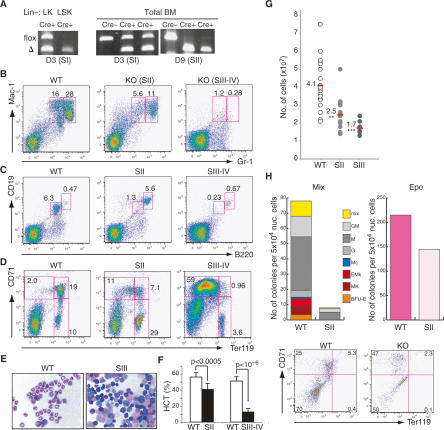
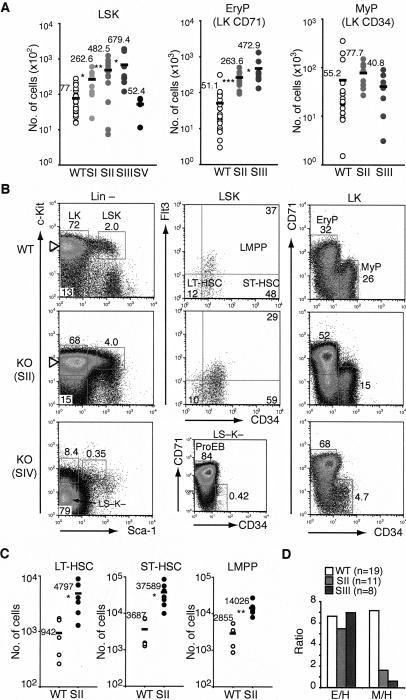
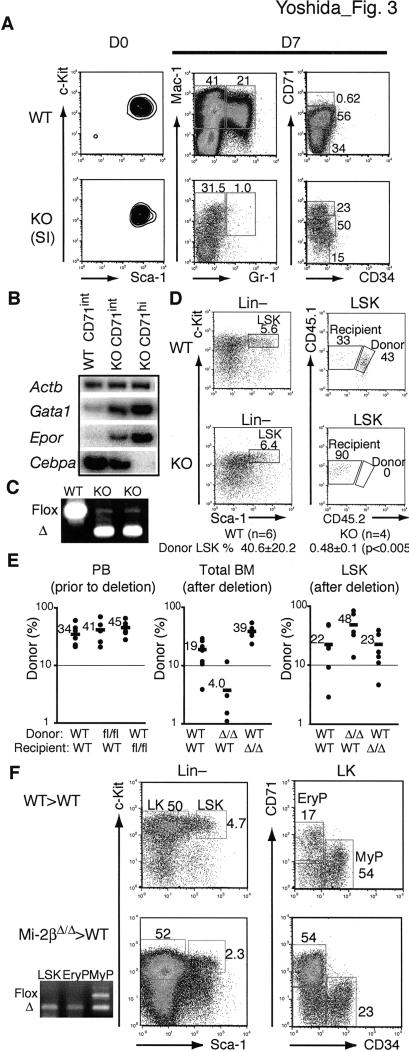
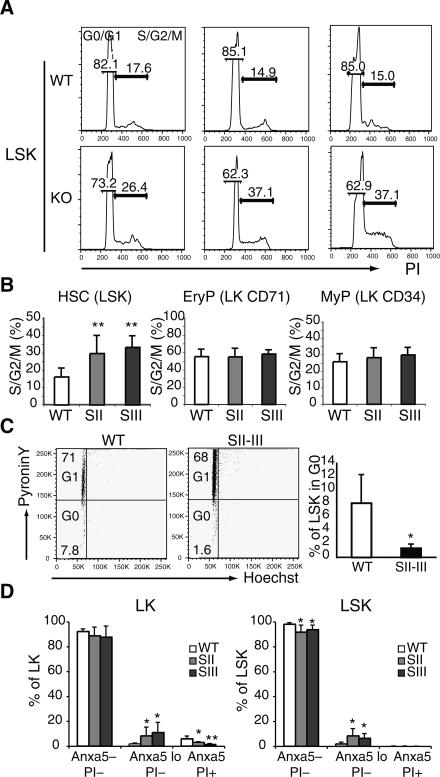
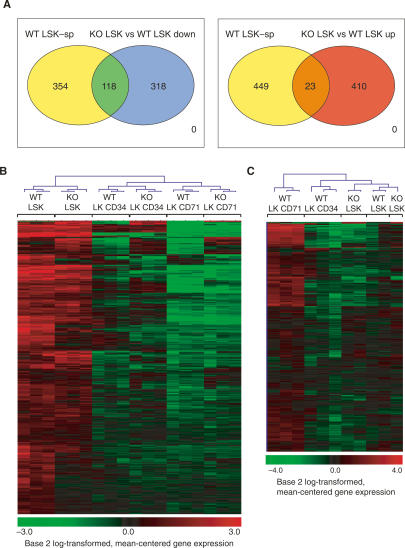
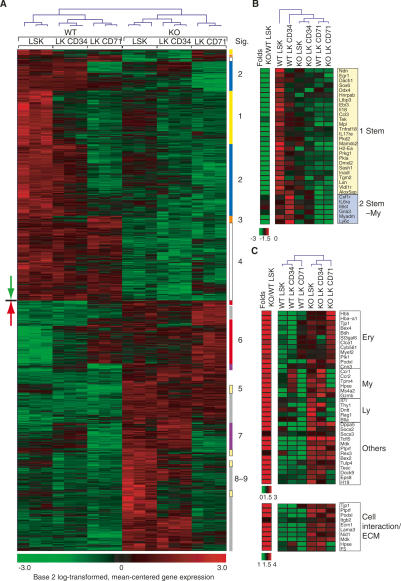
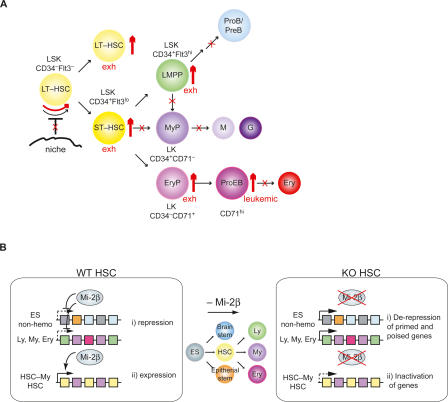
The ability of somatic stem cells to self-renew and differentiate into downstream lineages is dependent on specialized chromatin environments that keep stem cell-specific genes active and key differentiation factors repressed but poised for activation. The epigenetic factors that provide this type of regulation remain ill-defined. Here we provide the first evidence that the SNF2-like ATPase Mi-2beta of the Nucleosome Remodeling Deacetylase (NuRD) complex is required for maintenance of and multilineage differentiation in the early hematopoietic hierarchy. Shortly after conditional inactivation of Mi-2beta, there is an increase in cycling and a decrease in quiescence in an HSC (hematopoietic stem cell)-enriched bone marrow population. These cycling mutant cells readily differentiate into the erythroid lineage but not into the myeloid and lymphoid lineages. Together, these effects result in an initial expansion of mutant HSC and erythroid progenitors that are later depleted as more differentiated proerythroblasts accumulate at hematopoietic sites exhibiting features of erythroid leukemia. Examination of gene expression in the mutant HSC reveals changes in the expression of genes associated with self-renewal and lineage priming and a pivotal role of Mi-2beta in their regulation. Thus, Mi-2beta provides the hematopoietic system with immune cell capabilities as well as with an extensive regenerative capacity.


Figures

Figure 1.
Figure 1.
Loss of Mi-2β causes depletion of myeloid and lymphoid cells and accumulation of erythroid cells. (A) PCR analysis of genomic DNA prepared from LSK and LK subsets and from total BM of wild-type (WT) and Mi-2βfl/fl mice at 3 and 9 d post-induction. Flox and Δ designate the loxP-containing wild-type Mi-2β and the deleted allele, respectively. Cre− and Cre+ denote the Mi-2βfl/fl; Mx-Cre and Mx-Cre+ mice, respectively. Myeloid (B), B-cell (C), and erythroid lineage (D) analysis performed in the Mi-2βΔ/Δ BM at stages II–IV after deletion is shown. Mac-1 and Gr-1 demarcate cells of the myeloid lineage, B220 and CD19 indicate cells of the B-cell lineage, and CD71 and Ter119 indicate successive erythroid lineage transitions from proerythroblast to mature erythrocyte. (E) May-Giemsa staining of total BM cells at ≥2 wk after Mi-2β deletion. (F) Hematocrits of wild-type and mutants (KO) during the stage II–IV period. (G) BM cellularity at stage II (n = 13) and stage III (n = 8) of Mi-2β deletion. Similarly treated wild-type littermates are shown as one group (n = 21). (H) Colony assays on wild-type and Mi-2β KO BM (SII) indicate a dramatic depletion of myeloid (Mix) but not of erythroid (Epo) progenitor activity. Mutant erythroid (CFU-E) colonies (shown as light pink) consisted of fewer and larger cells than normal colonies and were more difficult to score. This correlated with their inability to progress past the ProEB stage, which was confirmed by FACS analysis of mutant cultures for the erythroid differentiation markers CD71 and Ter119. One representative out of five independent colony assays with similar results is shown.
Figure 2.
Figure 2.
A dramatic expansion of Mi-2β-deficient HSC and erythroid progenitors. (A) The absolute number of HSC (LSK), erythroid (LK CD71+ CD34), and myeloid (LK CD71 CD34+) progenitor populations is provided for stages I–III (SI, n = 8; SII, n = 13; SIII, n = 8; SV, n = 4; 3–14 d) after induction of deletion in wild type and KO. As no substantial variation in the number or profile of wild-type LSK (n = 23) and LK (n = 18) subsets was seen, these are shown collectively as one group. Each circle represents data from one animal, and the black bar indicates the mean value for each group. (*) P < 0.05; (**) P < 0.005; (***) P < 0.0005. (B) Representative profiles of wild-type and KO LSK and LK subsets at stages II and IV after induction. At stage II, the effects of Mi-2β deletion on LT-HSC (Flt3CD34), ST-HSC (Flt3intCD34+), and LMPP (Flt3+CD34+) are provided. At stage IV, the accumulation of LSK ProEB in the Lin compartment is shown. (C) The absolute number of wild-type (n = 5) and mutant (n = 7) LT-HSC, ST-HSC, and LMPP is provided for stage II. For each population, the average number of cells (black bar) is provided. (D) The ratio of erythroid progenitors to HSC-LSK (E/H) or myeloid progenitors to HSC-LSK (M/H) is shown for wild type (n = 19) and KO at 1–2 wk post-induction (SII, n = 11; SIII, n = 8).
Figure 3.
Figure 3.
In vitro and in vivo differentiation properties of Mi-2β-deficient HSC. (A) Sorted (D0) wild-type and mutant LSK from stage I were cultured under multilineage differentiation conditions for 7 d (D7) and then analyzed for surface expression of myeloid (Mac1+Gr1+) and erythroid (CD71hi) markers and for lineage-specific RNAs. (B) For the RNA studies, semiquantitative RT–PCR was performed for representative erythroid (Gata1 and Epor) and myeloid (Cebpa) lineage genes on sorted wild-type and KO CD71int cells and KO CD71hi cells from day 7 cultures. (C) PCR analysis of genomic DNA confirmed the respective wild-type or mutant origin of these cells. One representative out of three independent experiments with similar outcomes is shown. (D) One representative plot of donor (CD45.1/CD45.2) contribution of 5000 wild-type (Mi-2βfl/fl) and mutant (Mi-2βΔ/Δ) LSK deleted 24–36 h after transplantation is shown at 2 wk after treatment. The average donor percentage of contribution of wild-type (n = 6) and mutant (n = 4) experiments is indicated. (E) The wild-type (Mi-2βfl/fl) and mutant (Mi-2βΔ/Δ) LSK contributions were also examined after stable chimerism was first established. Donor contribution (% CD45.2) before and after Mi-2β deletion in the peripheral blood (PB), BM lineage-positive (Total BM), and LSK populations was determined by flow cytometry (WT > WT, n = 8; Mi-2βfl/fl > WT, n = 5; Mi-2βΔ/Δ > WT, n = 5; WT > Mi-2βΔ/Δ, n = 7). The average donor contribution (black bar) in each group is indicated. (F) For three of the Mi-2βΔ/Δ > WT recipients shown in E, a major mutant contribution in LSK and LK erythroid progenitors (CD71+) but not in the LK myeloid (CD34+) progenitors was independently confirmed by PCR analysis of genomic DNA from sorted populations (as described in Fig. 1A).
Figure 4.
Figure 4.
Loss of quiescence and increase in cycling and apoptosis in Mi-2β-deficient HSC. The cell cycle distribution (G0/G1 and S/G2/M) of sorted LSK and erythroid and myeloid LK subsets from wild-type (Mi-2βfl/fl) and mutant (Mi-2βΔ/Δ) BM at stages I–III was revealed by PI staining. Representative cell cycle profiles for the LSK are shown in A. The percentage of cells in the S/G2/M phase of the cell cycle and the statistical analysis of all experiments are shown in B. Wild type, n = 9; KO SII, n = 9; and SIII, n = 3. (**) P < 0.005. (C) To further distinguish the G0 from G1 content of wild-type and KO LSK at stage II, PyroninY/Hoechst staining was used. Representative flow cytometry profiles are shown on the left. Statistical analysis for G0 distribution of all these studies is shown on the right. Wild type, n = 4; KO SII–SIII, n = 7. (D) The apoptotic index of wild-type and KO LSK at stages II–III and their progeny was revealed by Annexin V and PI staining (Annexin Vlo PI). Wild type, n = 7; KO SII, n = 6; and SIII, n = 5. (*) P < 0.05; (**) P < 0.005.
Figure 5.
Figure 5.
The Mi-2β-deficient HSC retain their transcriptional identity. (A, left) A venn diagram displaying the overlap between genes down-regulated in KO LSK and genes that are specifically expressed in wild-type LSK. This LSK-specific group of genes (transcriptional signature) was deduced by comparative analysis of the wild-type LSK data sets to the wild-type LK erythroid and myeloid progenitor data sets and exhibits significant overlap with previously published LT-HSC databases (Ivanova et al. 2002; Ramalho-Santos et al. 2002). This analysis indicates that the majority of the LSK-specific (LSK-sp) transcriptional signature (354 out of 472 gene-specific probe sets) remains intact in the KO. However, functionally important differences (118 out of 472 gene-specific probe sets) between wild-type and KO LSK are also revealed. (Right) Overlap between the wild-type LSK-specific group of genes and genes up-regulated in the KO LSK. A small subset of wild-type LSK-specific genes was also up-regulated in the absence of Mi-2β (23 out of 472). (B) Unbiased clustering of wild-type and KO LSK (HSC), LK CD34 (myeloid), and LK CD71 (erythroid) populations according to the LSK-specific transcriptional signature (as in A). (C) Unbiased clustering of KO LSK with wild-type LSK, LK CD34, and LK CD71 subsets according to an erythroid progenitor-specific group of genes (LK CD71-specific signature) deduced by comparative analysis of wild-type LSK and LK data sets. Unbiased clustering analysis from both B and C indicates that KO LSK has a gene expression profile that is most similar to its wild-type counterpart and distinct from those of its LK erythroid or myeloid progeny (data not shown).
Figure 6.
Figure 6.
Specific effects of Mi-2β deficiency on the gene expression profiles of the HSC. (A) Unique genes deregulated in the KO LSK (356, green down arrow; 347, red up arrow) and clustered in a hierarchical manner across wild-type and KO LSK and LK segregate into distinct transcriptional groups. The down-regulated genes segregate into LSK-specific (group 1; Stem: yellow), LSK and LK CD34-specific (group 2; Stem-My, blue), LSK and LK CD71-specific (group 3; Stem-Ery, orange), and expressed in all (group 4; All, white) subsets. The up-regulated genes fall into LSK-specific (group 5: Stem, yellow), LK CD71-specific (group 6; Ery, red), LK CD34-specific (group 7; My, purple), and neg-low in all (group 8/-9, gray) subsets. (B) Representative genes from groups 1–4 that are most relevant to the HSC’s expansion and differentiation phenotypes are presented. (C) Representative genes “overtly or cryptically primed” for expression in the erythroid (Ery), myeloid (My), and lymphoid (Ly) lineages as well as others are shown. A notable group of cell interaction/ECM genes up-regulated in KO LSK is also shown.
Figure 7.
Figure 7.
A direct role of Mi-2β in lineage priming in hematopoietic progenitors. (A) Hbb-b1, an erythroid lineage gene, and Rag1, a lymphoid lineage gene, both reported as primed in the HSC (Miyamoto and Akashi 2005; Mansson et al. 2007), were rapidly up-regulated upon loss of Mi-2β in LSK and LK subsets (see also Supplemental Fig. 4A). (B) ChIP analysis for Mi-2β was performed at the promoters of Hbb-b1 and Rag1, and upstream regions of Hbb-b1 (IVR) and Rag-1 (Rag1 UP) and the Cd4 silencer in hematopoietic progenitor populations (+HSC), in ES cells, and in thymocytes (thymus). ChIPs were analyzed by multiplex PCR of test (Hbb-b1, IVR, Rag1, Rag1 UP, and CD4 Sil) and internal control regions (star). The average fold enrichment ratio relative to the input ratio deduced from all experiments and the number of independent chromatin preparations used for these studies is shown at the bottom of each panel. PCR analysis of ChIPs was repeated at least twice. (C) Permissive meH3K4 and AcH3 histone modifications were examined at the promoters of the Hbb-b1 and Rag1 genes and at control regions (IVR and Rag1 UP) in LSK and LK progenitor populations isolated from wild-type (Mi-2β+) and KO (Mi-2β−) mice. The calculated enrichment ratio relative to input ratio is provided for each panel. Two independent LSK and LK chromatin preparations were used for these studies, and each was analyzed twice. The only exception is the AcH3 study on the Rag1 locus, where one ChIP was analyzed twice. (*) P < 0.05; (**) P < 0.005.
Figure 8.
Figure 8.
Cellular and molecular effects of Mi-2β in the early hematopoietic hierarchy. (A) The effects of Mi-2β deletion in early hematopoiesis. The increase in hematopoietic populations detected after Mi-2β deletion is shown by thick red up arrows. Blocks in differentiation or in potential HSC interaction with a regenerative niche are depicted with red crosses. Increase in the cycling of mutant HSC is indicated by a red curved arrow. The eventual exhaustion (exh) of HSC and progenitors at later stages of Mi-2β deletion and accumulation of potentially neoplastic (neo) proerythroblasts is also indicated. Markers used throughout our studies for immuno-phenotyping of HSC, MPP, and more restricted progeny are shown. (B) A model of Mi-2β’s specific effects on the transcriptional profiles of HSCs and early progenitors. (i) Mi-2β is permissive for repression of genes in the HSC compartment that fall into two categories. One consists of genes characteristic of a later stage of hemo-lymphoid differentiation (Ly, My, and Ery) that are overtly or cryptically primed for expression in the HSC compartment. The second consists of relics from an earlier stage of differentiation (ES non-hemo) that are still accessible in the HSC and that become permanently silenced upon further restriction into one of the hematopoietic fates. (ii) Mi-2β is also permissive for expression and priming of a significant subset of HSC-specific and HSC-myeloid-specific genes. Some of these may be key for HSC maintenance by promoting niche interactions and signaling that lead to a protracted cell cycle and guard against excessive cycling. Others may be key for myeloid lineage priming and differentiation.

Similar articles

Cited by

References

    1. Adams G.B., Chabner K.T., Alley I.R., Olson D.P., Szczepiorkowski Z.M., Poznansky M.C., Kos C.H., Pollak M.R., Brown E.M., Scadden D.T. Stem cell engraftment at the endosteal niche is specified by the calcium-sensing receptor. Nature. 2006;439:599–603. - PubMed
    1. Adolfsson J., Mansson R., Buza-Vidas N., Hultquist A., Liuba K., Jensen C.T., Bryder D., Yang L., Borge O.J., Thoren L.A., et al. Identification of Flt3+ lympho-myeloid stem cells lacking erythro-megakaryocytic potential a revised road map for adult blood lineage commitment. Cell. 2005;121:295–306. - PubMed
    1. Akashi K., Traver D., Miyamoto T., Weissman I.L. A clonogenic common myeloid progenitor that gives rise to all myeloid lineages. Nature. 2000;404:193–197. - PubMed
    1. Arai F., Hirao A., Ohmura M., Sato H., Matsuoka S., Takubo K., Ito K., Koh G.Y., Suda T. Tie2/angiopoietin-1 signaling regulates hematopoietic stem cell quiescence in the bone marrow niche. Cell. 2004;118:149–161. - PubMed
    1. Bernstein B.E., Mikkelsen T.S., Xie X., Kamal M., Huebert D.J., Cuff J., Fry B., Meissner A., Wernig M., Plath K., et al. A bivalent chromatin structure marks key developmental genes in embryonic stem cells. Cell. 2006;125:315–326. - PubMed

Publication types

MeSH terms