

Potential use of quantitative tissue phenotype to predict malignant risk for oral premalignant lesions
- PMID: 18451134
- PMCID: PMC2693059
- DOI: 10.1158/0008-5472.CAN-07-2113
Potential use of quantitative tissue phenotype to predict malignant risk for oral premalignant lesions
Abstract
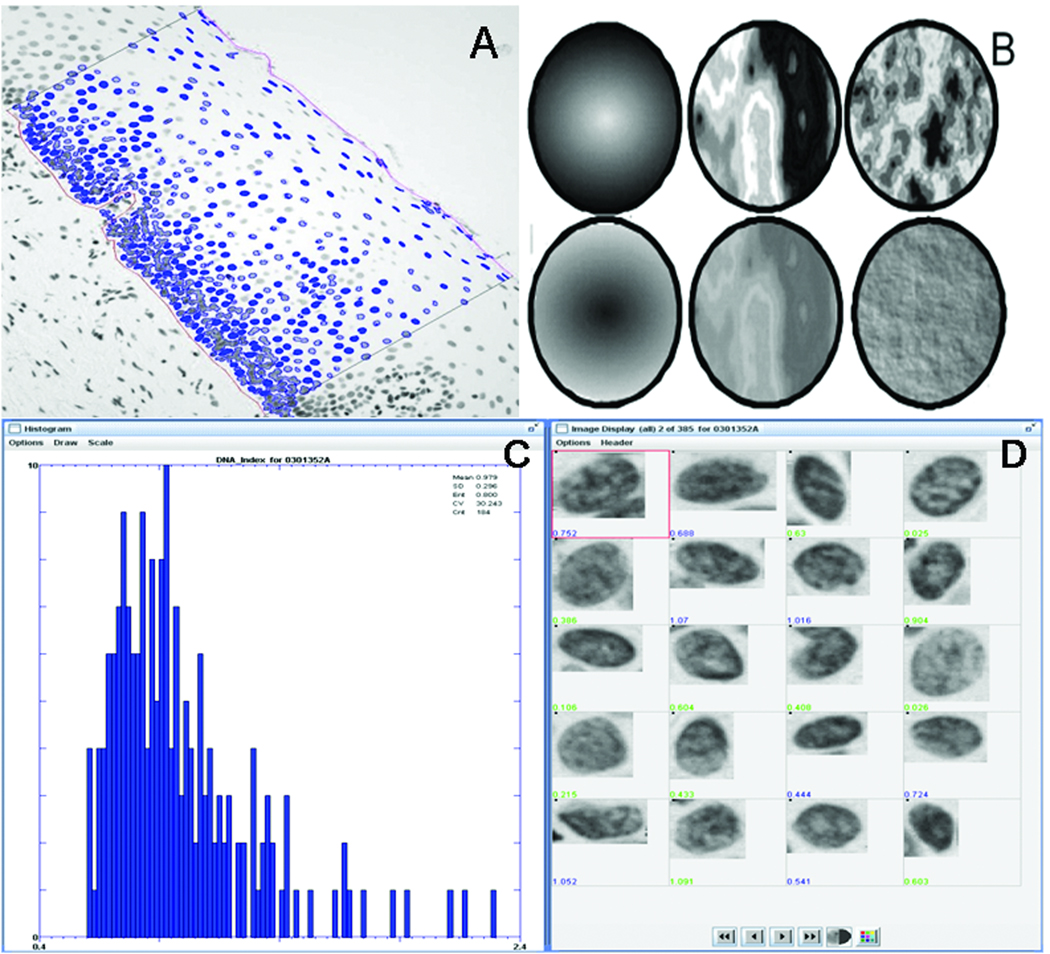
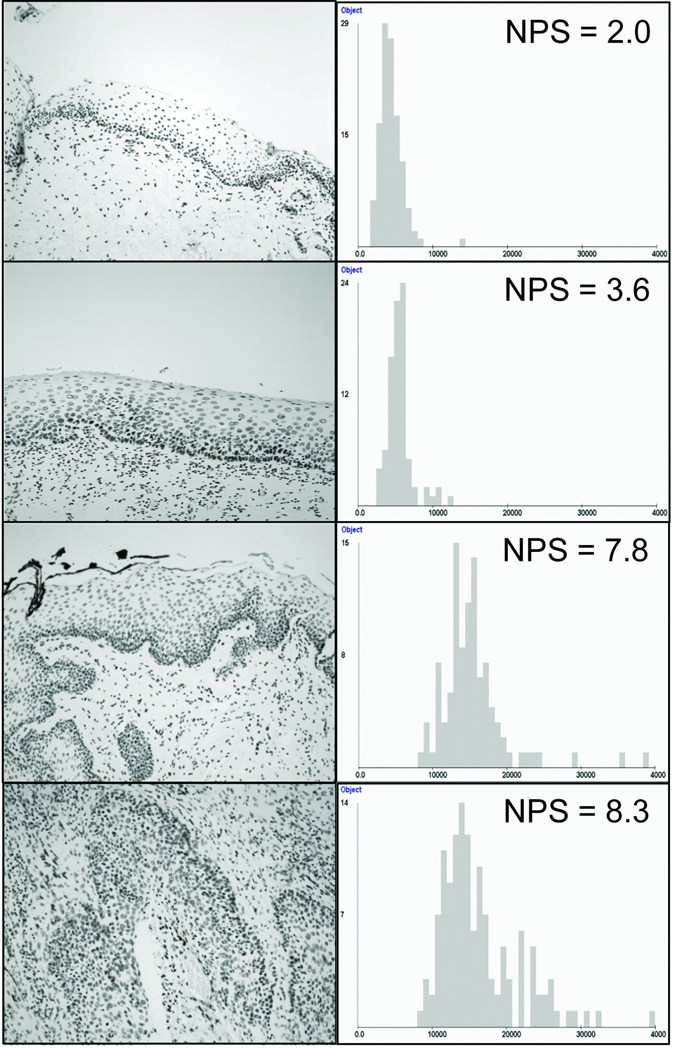
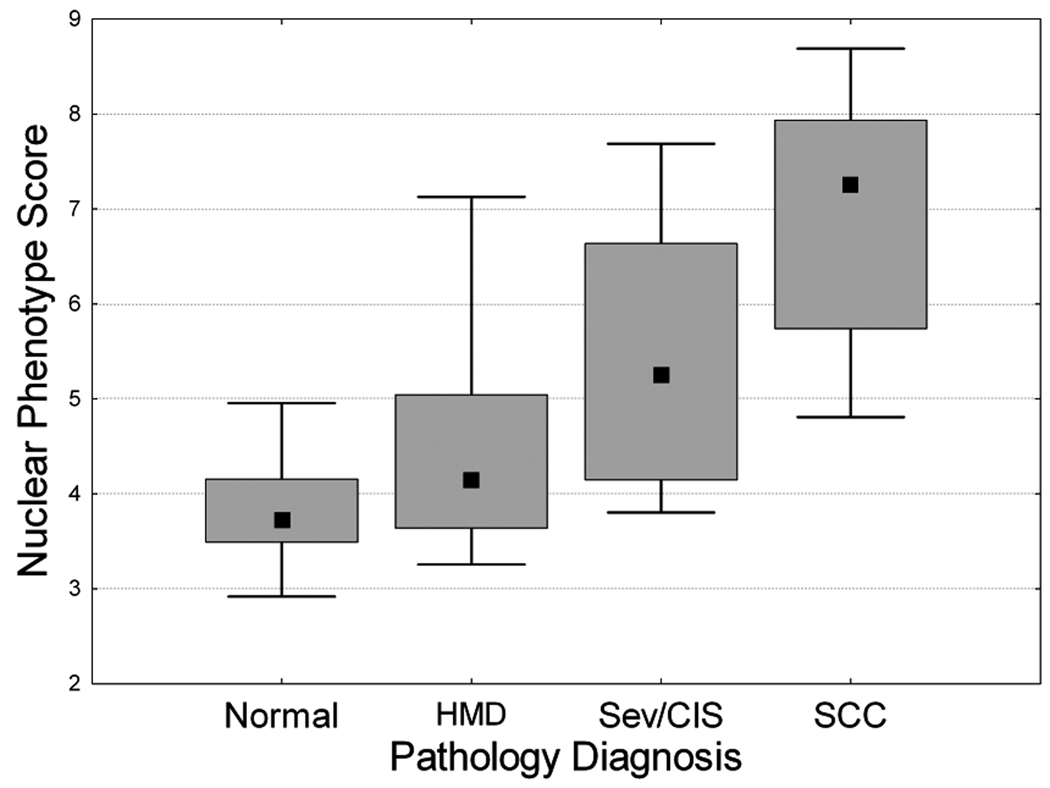
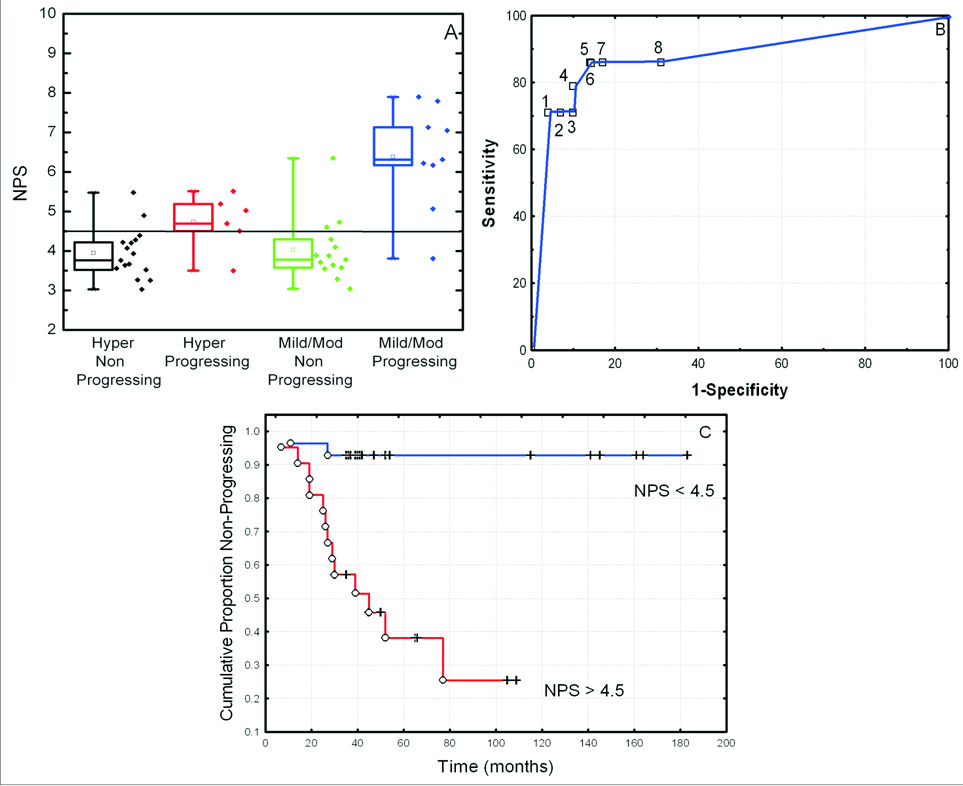
The importance of early diagnosis in improving mortality and morbidity rates of oral squamous cell carcinoma (SCC) has long been recognized. However, a major challenge for early diagnosis is our limited ability to differentiate oral premalignant lesions (OPL) at high risk of progressing into invasive SCC from those at low risk. We investigated the potential of quantitative tissue phenotype (QTP), measured by high-resolution image analysis, to identify severe dysplasia/carcinoma in situ (CIS; known to have an increased risk of progression) and to predict progression to cancer within hyperplasia or mild/moderate dysplasia. We generated a nuclear phenotype score (NPS), a combination of five nuclear morphometric features that best discriminate 4,027 "normal" nuclei (selected from 29 normal oral biopsies) from 4,298 "abnormal" nuclei (selected from 30 SCC biopsies). This NPS was then determined for a set of 69 OPLs. Severe dysplasia/CIS showed a significant increase in NPS compared with hyperplasia or mild/moderate dysplasia. However, within the latter group, elevated NPS was strongly associated with the presence of high-risk loss of heterozygosity (LOH) patterns. There was a statistical difference between NPS of hyperplasia or mild/moderate dysplasia that progressed to cancer and those that did not. Individuals with a high NPS had a 10-fold increase in relative risk of progression. In the multivariate Cox model, LOH and NPS together were the strongest predictors for cancer development. These data suggest that QTP could be used to identify lesions that require molecular evaluation and should be integrated with such approaches to facilitate the identification of hyperplasia or mild/moderate dysplasia OPLs at high risk of progression.
Figures
Similar articles
-
Automated classification of oral premalignant lesions using image cytometry and Random Forests-based algorithms.Cell Oncol (Dordr). 2014 Jun;37(3):193-202. doi: 10.1007/s13402-014-0172-x. Epub 2014 May 10. Cell Oncol (Dordr). 2014. PMID: 24817187
-
Utility of toluidine blue in oral premalignant lesions and squamous cell carcinoma: continuing research and implications for clinical practice.Head Neck. 2007 Oct;29(10):948-58. doi: 10.1002/hed.20637. Head Neck. 2007. PMID: 17764090 Review.
-
Loss of heterozygosity (LOH) profiles--validated risk predictors for progression to oral cancer.Cancer Prev Res (Phila). 2012 Sep;5(9):1081-9. doi: 10.1158/1940-6207.CAPR-12-0173. Epub 2012 Aug 21. Cancer Prev Res (Phila). 2012. PMID: 22911111 Free PMC article.
-
Markers for dysplasia of the upper aerodigestive tract. Suprabasal expression of PCNA, p53, and CK19 in alcohol-fixed, embedded tissue.Am J Pathol. 1992 Oct;141(4):817-25. Am J Pathol. 1992. PMID: 1384338 Free PMC article.
-
Loss of heterozygosity: a potential tool in management of oral premalignant lesions?J Oral Pathol Med. 2001 Oct;30(9):513-20. doi: 10.1034/j.1600-0714.2001.300901.x. J Oral Pathol Med. 2001. PMID: 11555152 Review.
Cited by
-
Targeting of chemoprevention to high-risk potentially malignant oral lesions: challenges and opportunities.Oral Oncol. 2014 Dec;50(12):1123-30. doi: 10.1016/j.oraloncology.2014.08.012. Epub 2014 Sep 16. Oral Oncol. 2014. PMID: 25240917 Free PMC article.
-
An Update on the Use of Artificial Intelligence in Digital Pathology for Oral Epithelial Dysplasia Research.Head Neck Pathol. 2024 May 10;18(1):38. doi: 10.1007/s12105-024-01643-4. Head Neck Pathol. 2024. PMID: 38727841 Free PMC article. Review.
-
Multi-analyte network markers for tumor prognosis.PLoS One. 2012;7(12):e52973. doi: 10.1371/journal.pone.0052973. Epub 2012 Dec 26. PLoS One. 2012. PMID: 23300836 Free PMC article.
-
New hope for an oral cancer solution: together we can make a difference.J Can Dent Assoc. 2008 Apr;74(3):261-6. J Can Dent Assoc. 2008. PMID: 18387266 Free PMC article.
-
Large-scale DNA organization is a prognostic marker of breast cancer survival.Med Oncol. 2017 Dec 6;35(1):9. doi: 10.1007/s12032-017-1068-1. Med Oncol. 2017. PMID: 29214466
References
-
- Vedtofte P, Holmstrup P, Hjorting-Hansen E, Pindborg JJ. Surgical treatment of premalignant lesions of the oral mucosa. Int J Oral Maxillofac Surg. 1987;16(6):656–664. - PubMed
-
- Thomson PJ, Wylie J. Interventional laser surgery: an effective surgical and diagnostic tool in oral precancer management. Int J Oral Maxillofac Surg. 2002;31(2):145–153. - PubMed
-
- Silverman S Jr, editor. Oral Cancer. Ed. 3. Atlanta, GA: American Cancer Society; 1990.
-
- Silverman S, Jr, Gorsky M, Lozada F. Oral leukoplakia and malignant transformation: a follow-up study of 257 patients. Cancer. 1984;53:563–568. - PubMed
-
- Mincer HH, Coleman SA, Hopkins KP. Obswervations on the clinical characteristics of oral lesions showing histologic epithelial dysplasia. Oral Surg Oral Med Oral Pathol. 1972;33(3):389–399. - PubMed
Publication types
MeSH terms
Grants and funding
LinkOut - more resources
Full Text Sources
Medical
Research Materials
