Pituitary tumor-transforming 1 increases cell motility and promotes lymph node metastasis in esophageal squamous cell carcinoma
- PMID: 18451147
- PMCID: PMC2988648
- DOI: 10.1158/0008-5472.CAN-07-3043
Pituitary tumor-transforming 1 increases cell motility and promotes lymph node metastasis in esophageal squamous cell carcinoma
Abstract
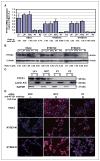
Human pituitary tumor-transforming 1 (PTTG1)/securin is a putative oncoprotein that is overexpressed in various tumor types. However, the involvement of PTTG1 in gastrointestinal cancer development and progression remains unclear. In this study, we investigated the clinical significance and biological effects of PTTG1 in esophageal squamous cell carcinoma (ESCC). Immunohistochemical studies performed on 113 primary ESCC specimens revealed a high prevalence of PTTG1 overexpression (60.2%), which was significantly associated with lymph node metastasis (regional, P = 0.042; distant, P = 0.005), advanced tumor stage (P = 0.028), and poorer overall survival (P = 0.017, log-rank test; P = 0.044, Cox proportional hazard model). Eleven ESCC cell lines expressed PTTG1 protein at levels 2.4 to 6.6 times higher than those in normal esophageal epithelial cells (HEEpiC). PTTG1 protein expression was confined to the nucleus in HEEpiC cells but present in both the cytoplasm and nucleus in ESCC cells. Two small interfering RNAs (siRNA) inhibited PTTG1 mRNA and protein expression in three ESCC cell lines by 77% to 97%. In addition, PTTG1 down-regulation by these siRNAs significantly reduced cell motility in all three ESCC cell lines (P < 0.01) in vitro, as well as popliteal lymph node metastases of ESCC cells in nude mice (P = 0.020). Global gene expression profiling suggested that several members of the Ras and Rho gene families, including RRAS, RHOG, ARHGAP1, and ARHGADIA, represented potential downstream genes in the PTTG1 pathway. Taken together, these findings suggest that PTTG1 overexpression promotes cell motility and lymph node metastasis in ESCC patients, leading to poorer survival. Thus, PTTG1 constitutes a potential biomarker and therapeutic target in ESCCs with lymph node metastases.
Figures


Similar articles
-
BRCA1-Associated Protein Increases Invasiveness of Esophageal Squamous Cell Carcinoma.Gastroenterology. 2017 Nov;153(5):1304-1319.e5. doi: 10.1053/j.gastro.2017.07.042. Epub 2017 Aug 2. Gastroenterology. 2017. PMID: 28780075
-
Solute Carrier Family 39 Member 6 Gene Promotes Aggressiveness of Esophageal Carcinoma Cells by Increasing Intracellular Levels of Zinc, Activating Phosphatidylinositol 3-Kinase Signaling, and Up-regulating Genes That Regulate Metastasis.Gastroenterology. 2017 Jun;152(8):1985-1997.e12. doi: 10.1053/j.gastro.2017.02.006. Epub 2017 Feb 14. Gastroenterology. 2017. PMID: 28209530
-
Nuclear Localization of DNAJB6 Is Associated With Survival of Patients With Esophageal Cancer and Reduces AKT Signaling and Proliferation of Cancer Cells.Gastroenterology. 2015 Dec;149(7):1825-1836.e5. doi: 10.1053/j.gastro.2015.08.025. Epub 2015 Aug 22. Gastroenterology. 2015. PMID: 26302489
-
An inducible short-hairpin RNA vector against osteopontin reduces metastatic potential of human esophageal squamous cell carcinoma in vitro and in vivo.Clin Cancer Res. 2006 Feb 15;12(4):1308-16. doi: 10.1158/1078-0432.CCR-05-1611. Clin Cancer Res. 2006. PMID: 16489088
-
PTTG overexpression promotes lymph node metastasis in human esophageal squamous cell carcinoma.Cancer Res. 2009 Apr 15;69(8):3283-90. doi: 10.1158/0008-5472.CAN-08-0367. Epub 2009 Apr 7. Cancer Res. 2009. PMID: 19351864
Cited by
-
PTTG and PBF Functionally Interact with p53 and Predict Overall Survival in Head and Neck Cancer.Cancer Res. 2018 Oct 15;78(20):5863-5876. doi: 10.1158/0008-5472.CAN-18-0855. Epub 2018 Aug 28. Cancer Res. 2018. PMID: 30154144 Free PMC article.
-
TAK1 Phosphorylates RASSF9 and Inhibits Esophageal Squamous Tumor Cell Proliferation by Targeting the RAS/MEK/ERK Axis.Adv Sci (Weinh). 2021 Jan 6;8(5):2001575. doi: 10.1002/advs.202001575. eCollection 2021 Mar. Adv Sci (Weinh). 2021. PMID: 33717835 Free PMC article.
-
Bioinformatics identification of lncRNA biomarkers associated with the progression of esophageal squamous cell carcinoma.Mol Med Rep. 2019 Jun;19(6):5309-5320. doi: 10.3892/mmr.2019.10213. Epub 2019 May 2. Mol Med Rep. 2019. PMID: 31059058 Free PMC article.
-
Low levels of tumour suppressor miR-655 in plasma contribute to lymphatic progression and poor outcomes in oesophageal squamous cell carcinoma.Mol Cancer. 2019 Jan 4;18(1):2. doi: 10.1186/s12943-018-0929-3. Mol Cancer. 2019. PMID: 30609933 Free PMC article.
-
Clinical significance and potential regulatory mechanism of overexpression of pituitary tumor-transforming gene transcription factor in bladder cancer.BMC Cancer. 2022 Jun 29;22(1):713. doi: 10.1186/s12885-022-09810-y. BMC Cancer. 2022. PMID: 35768832 Free PMC article.
References
-
- Parkin DM, Bray F, Ferlay J, Pisani P. Global cancer statistics, 2002. CA Cancer J Clin. 2005;55:74–108. - PubMed
-
- Sato F, Shimada Y, Li Z, Watanabe G, Maeda M, Imamura M. Lymph node micrometastasis and prognosis in patients with oesophageal squamous cell carcinoma. Br J Surg. 2001;88:426–32. - PubMed
-
- Pei L, Melmed S. Isolation and characterization of a pituitary tumor-transforming gene (PTTG) Mol Endocrinol. 1997;11:433–41. - PubMed
-
- Bradshaw C, Kakar SS. Pituitary tumor transforming gene: an important gene in normal cellular functions and tumorigenesis. Histol Histopathol. 2007;22:219–26. - PubMed
-
- Shibata Y, Haruki N, Kuwabara Y, et al. Expression of PTTG (pituitary tumor transforming gene) in esophageal cancer. Jpn J Clin Oncol. 2002;32:233–7. - PubMed
Publication types
MeSH terms
Substances
Grants and funding
LinkOut - more resources
Full Text Sources
Medical

