. 2008 May 1;68(9):3286-94.
doi: 10.1158/0008-5472.CAN-07-6867.

Pten haploinsufficiency accelerates formation of high-grade astrocytomas

Affiliations

Pten haploinsufficiency accelerates formation of high-grade astrocytomas

Chang-Hyuk Kwon et al. Cancer Res. .

Abstract

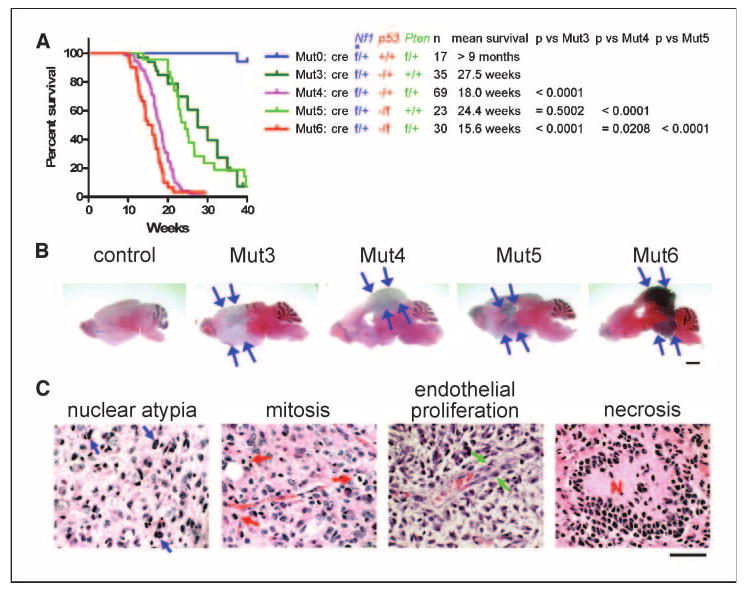
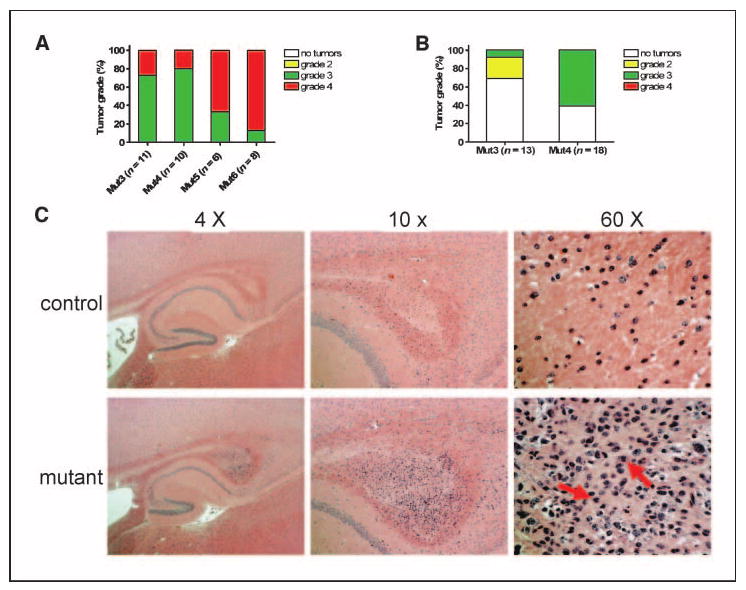
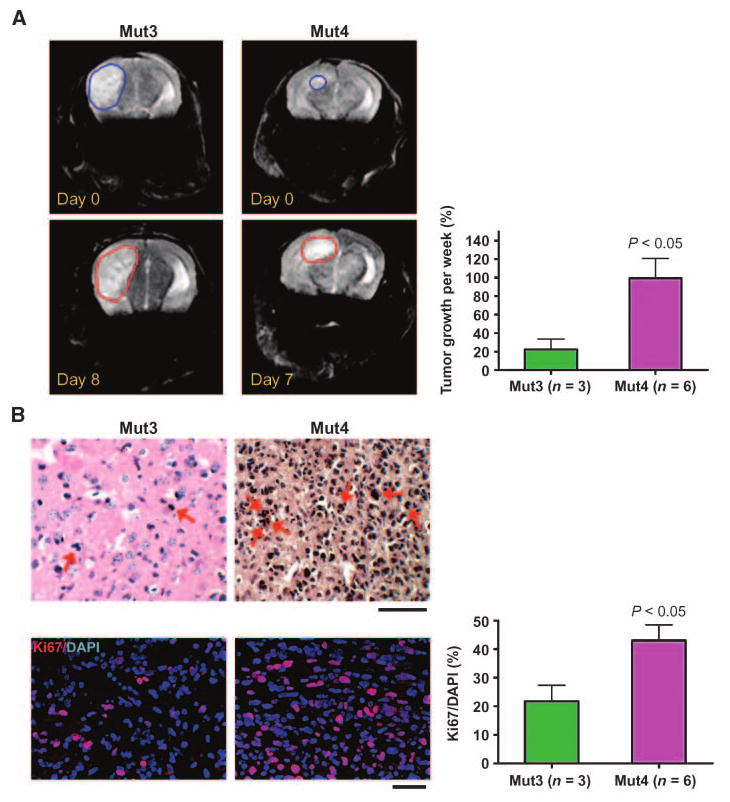
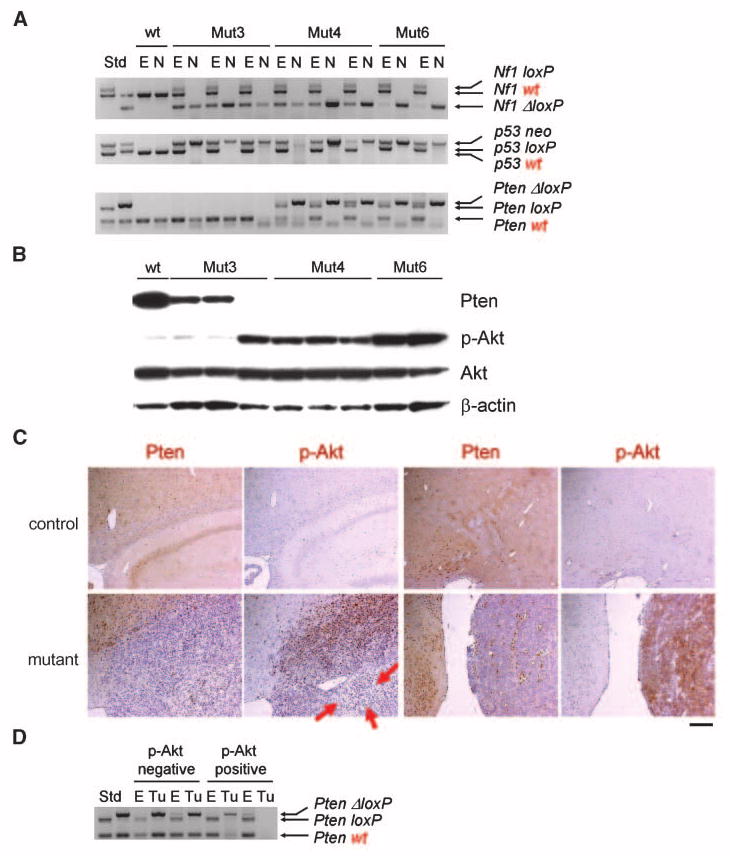
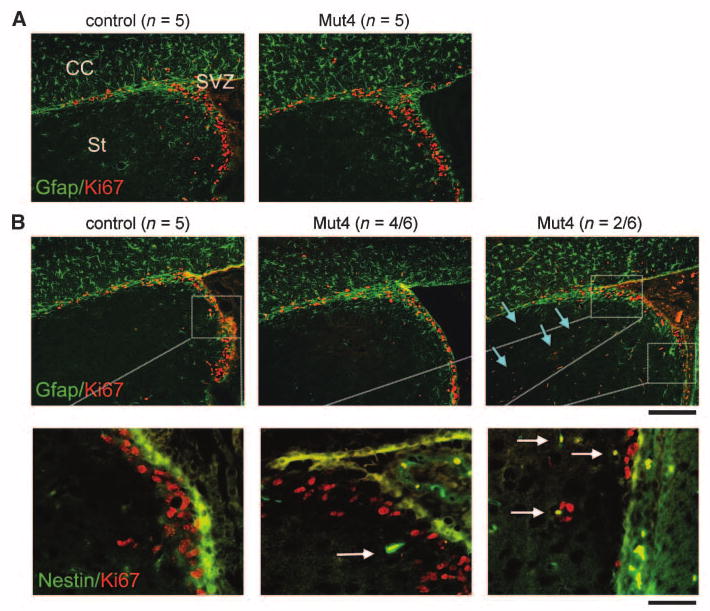
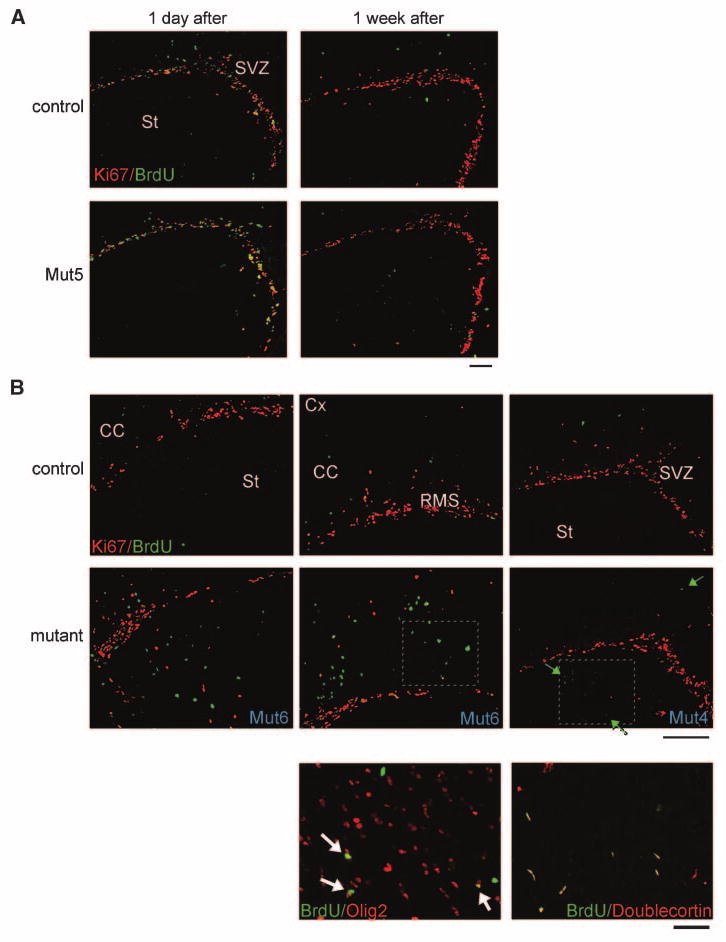
We previously reported that central nervous system (CNS) inactivation of Nf1 and p53 tumor suppressor genes in mice results in the development of low-grade to high-grade progressive astrocytomas. When the tumors achieve high grade, they are frequently accompanied by Akt activation, reminiscent of the frequent association of PTEN mutations in human high-grade glioma. In the present study, we introduced CNS heterozygosity of Pten into the Nf1/p53 astrocytoma model. Resulting mice had accelerated morbidity, shortened survival, and full penetrance of high-grade astrocytomas. Haploinsufficiency of Pten accelerated formation of grade 3 astrocytomas, whereas loss of Pten heterozygosity and Akt activation coincided with progression into grade 4 tumors. These data suggest that successive loss of each Pten allele may contribute to de novo formation of high-grade astrocytoma and progression into glioblastoma, respectively, thus providing insight into the etiology of primary glioblastoma. The presence of ectopically migrating neural stem/progenitor lineage cells in presymptomatic Pten-deficient mutant brains supports the notion that these tumors may arise from stem/progenitor cells.


Figures

Figure 1
Figure 1
Somatic heterozygosity of Pten significantly shortens survival of brain tumor-forming Mut3 mice. A, comparative analysis on Kaplan-Meier survival curves of five mouse genotypes shows that mortalities of Mut4 or Mut6, but not of Mut5, mice were significantly earlier than that of Mut3 mice. Genetic configuration, number of mice, and mean survival of each genotype and P values between genotypes are shown next to the curves. *, flanked by two loxP sites. B, all symptomatic Mut3 to Mut6 mice analyzed (n = 11, 10, 6, and 8, respectively) harbored brain tumors (arrows), as shown in representative H&E-stained sections. Scale bar, 2 mm. C, brain tumors found in Mut3 to Mut6 mice exhibit morphologic features characteristic of diffusely infiltrating astrocytomas, including nuclear hyperchromasia and pleomorphism. Left, atypical astrocytic nuclei (blue arrows, for example), some of which surround normal cortical neurons. Features of high-grade astrocytomas, including mitotic index (red arrows, for example), endothelial proliferation (green arrows, for example), and necrosis (N) were also present. Scale bar, 50 μm.
Figure 2
Figure 2
Somatic heterozygosity of Pten accelerates high-grade astrocytoma formation with no evidence of low-grade tumorigenesis. A, all symptomatic Mut3 to Mut6 mice analyzed harbored grade 3 or grade 4 astrocytomas. See Fig. 1A for configuration of genotypes and Materials and Methods for tumor classification. B, of 13 asymptomatic Mut3 mice analyzed (mean, 14.5 wk), three contained grade 2 tumors and one had a grade 3 tumor. In contrast, 11 of 18 asymptomatic Mut4 mice (mean, 14.2 wk) harbored grade 3 tumors. No grade 2 tumors were observed in Mut4 mice. C, a 14-wk-old, asymptomatic Mut4 mouse had a small astrocytoma in the caudal corpus callosum. Higher magnification image reveals the presence of mitotic index (arrows), classifying the tumor as a grade 3 malignancy.
Figure 3
Figure 3
Mut4 tumors grow more rapidly than Mut3 tumors in vivo. A, representative MRI of a Mut3 mouse (n = 3) show tumor boundaries 8 d after (red) the first imaging (blue). The tumor growth was more prominent in Mut4 mice (n = 6). Analysis on tumor size detected by MRI indicates that Mut3 tumors grew 22.43 ± 11.25% (mean ± SE)/wk and Mut4 tumors, 99.45 ± 23.46%, demonstrating significantly faster growth of Mut4 than Mut3 tumors. See Materials and Methods for detailed MRI and tumor size measurement. B, representative images of H&E-stained astrocytoma sections analyzed after final MRI show increased mitotic index (arrows, for example) in Mut4 than in Mut3 tumors (top). Similarly, Ki67 immunoreactivity was higher in Mut4 than in Mut3 tumors (bottom). Statistical analysis of Ki67 density [the highest ratio of Ki67-positive to 4′,6-diamidino-2-phenylindole (DAPI)–positive cells] shows significantly higher value in Mut4 over Mut3 astrocytomas. Scale bars, 50 μm.
Figure 4
Figure 4
Decreased Pten expression and increased p-Akt levels in astrocytomas. A, Nf1 and p53 LOHs in all tumor-derived neurospheres (see Materials and Methods) accompany frequent Pten LOH. Genomic DNA from the ear (E) or neurospheres (N) derived from Mut3 to Mut6 astrocytomas was subjected to semiquantitative PCR. Size of each allele was compared with those of standard (Std). Whereas wt and mutant (loxP or neo) bands for Nf1 and p53 were found in all Mut3 to Mut6 ears, the wt bands were not detectable in all Mut3 to Mut6 tumor-derived neurospheres, indicating LOH of Nf1 and p53. LOH of Pten was also found in one Mut3 and all Mut4 or Mut6 cases. In most Mut3 to Mut6 cases, recombined loxP (ΔloxP) was also detected in the ear, probably due to partial cre activity. B, Western blotting on the tumor-derived neurospheres in A reveals decreased (two of three Mut3 cases) or lack of Pten expression (all other cases). p-Akt levels were commensurately elevated in all Pten-deficient samples. C, representative adult brain sections immunostained for Pten or p-Akt (brown) show abundant Pten expression and absence of p-Akt in controls. In contrast, representative high-grade astrocytomas from Mut6 mice displayed reduced or undetectable Pten expression and increased levels of p-Akt. There were some tumor regions lacking both Pten and p-Akt signals (arrows, for example). Scale bar, 200 μm. D, in vivo elevation of p-Akt correlates with Pten LOH. Genomic DNA from the ear or tumor sections (Tu) was subjected to semiquantitative PCR. Size of each allele was compared with those of standard. While p-Akt–negative astrocytomas (from Mut4 mice) retained wt and recombined loxP (ΔloxP) alleles, p-Akt–positive tumors showed decrease or absence of wt band.
Figure 5
Figure 5
Ectopic positioning of neural stem/progenitor lineage cells precedes the appearance of astrocytomas. Mut3 to Mut6 mice were subjected to detailed histologic and immunocytochemical analysis at various time points preceding any evidence from previous studies that tumors would be present. Brain sections were double-labeled for Ki67, a proliferation marker, and Gfap that is expressed in astrocytes and subsets of neural precursor populations. A, representative images indicate that, at 6 wk of age, there was no substantial difference in Ki67 and Gfap signal between genotypes. CC, corpus callosum; St, striatum. B, by 8 wk of age, two of six Mut4 mice exhibited abnormal Ki67-positive and Gfap-positive cells in the striatum (light blue arrows), which were rare or absent in all control and other Mut4 mice analyzed (top). Higher magnification from the SVZ of adjacent sections stained with Ki67 and nestin, a neural stem/progenitor marker, shows the presence of double-labeled cells (white arrows) in Mut4 sections, which were absent in control (bottom). Scale bar, 200 μm (top and middle) and 50 μm (bottom).
Figure 6
Figure 6
BrdUrd chasing reveals that ectopic migration of neural stem/progenitor lineage cells precedes the appearance of astrocytomas. Mutant and control mice were injected with BrdUrd at 6 wk of age and analyzed 1 d or 1 wk later. A, representative images show that there was no substantial difference between control and Mut5 brains for locations of BrdUrd or Ki67 signal. B, representative images of BrdUrd/Ki67 double-stained brain sections (top and middle) 1 wk after the BrdUrd pulsing exhibit that Mut6 or Mut4 brains harbor ectopically localized BrdUrd-positive cells in the striatum (St), corpus callosum (CC), and/or cortex (Cx), close to SVZ and RMS where neural stem/progenitors are normally present. Some of the BrdUrd-positive ectopic cells were stained by Ki67 (green arrows, for example) and also expressed doublecortin (bottom right). A majority of the BrdUrd-positive ectopic cells expressed Olig2 (bottom left). Such BrdUrd/doublecortin or BrdUrd/Olig2 double-positive cells were fewer or absent in the similar areas of control brains (not shown). Bottom, higher magnification images of immunostained, adjacent sections to the boxed area in the middle. Scale bar, 200 μm (top and middle) and 50 μm (bottom).

References

    1. Zhu Y, Parada LF. The molecular and genetic basis of neurological tumours. Nat Rev Cancer. 2002;2:616–26. - PubMed
    1. Kleihues P, Cavenee WK, editors. Pathology and genetics of tumours of the nervous system. Lyon: IARC Press; 2000.
    1. Maher EA, Furnari FB, Bachoo RM, et al. Malignant glioma: genetics and biology of a grave matter. Genes Dev. 2001;15:1311–33. - PubMed
    1. Stupp R, Mason WP, van den Bent MJ, et al. Radiotherapy plus concomitant and adjuvant temozolomide for glioblastoma. N Engl J Med. 2005;352:987–96. - PubMed
    1. Ding H, Roncari L, Shannon P, et al. Astrocyte-specific expression of activated p21-ras results in malignant astrocytoma formation in a transgenic mouse model of human gliomas. Cancer Res. 2001;61:3826–36. - PubMed

Publication types

MeSH terms