. 2008 May 1;68(9):3361-9.
doi: 10.1158/0008-5472.CAN-07-5817.

Sequential transcription factor targeting for diffuse large B-cell lymphomas

Affiliations

Sequential transcription factor targeting for diffuse large B-cell lymphomas

Leandro C Cerchietti et al. Cancer Res. .

Abstract

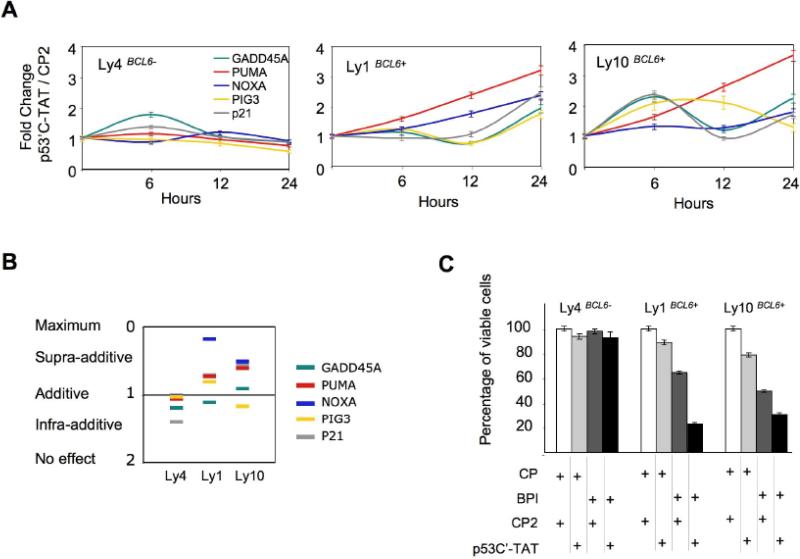
Transcription factors play a central role in malignant transformation by activating or repressing waves of downstream target genes. Therapeutic targeting of transcription factors can reprogram cancer cells to lose their advantages in growth and survival. The BCL6 transcriptional repressor plays a central role in the pathogenesis of diffuse large B-cell lymphomas (DLBCL) and controls downstream checkpoints, including the p53 tumor suppressor gene. We report that a specific inhibitor of BCL6 called BPI can trigger a p53 response in DLBCL cells. This was partially due to induction of p53 activity and partially due to relief of direct repression by BCL6 of p53 target genes. BPI could thus induce a p53-like response even in the presence of mutant p53. Moreover, sequential BCL6 peptide inhibitors followed by p53 peptide or small-molecule activators provided a more powerful antilymphoma effect than either treatment alone by maximally restoring p53 target gene expression. Therefore, tandem targeting of the overlapping BCL6 and p53 transcriptional programs can correct aberrant survival pathways in DLBCL and might provide an effective therapeutic approach to lymphoma therapy.


Figures

Figure 1
Figure 1. BPI induces p53 expression in DLBCL cells. Panel A
Ly4, Ly1, and Ly10 DLBCL cells were exposed to 5μM BPI for 48 h and mRNA collected for QPCR determination of p53 transcript abundance at the indicated time points. Results are expressed as fold of induction related to control peptide and normalized by GADPH. Panel B: Abundance of p53 protein in Ly4, Ly1 and Ly10 cells exposed to CP or BPI for 12 h, 24 h and 48 h. The bands intensity for p53 and actin were determined by densitometry and ratio of p53 to actin in cells treated with BPI vs. control peptide is shown on the right. All of these experiments were performed in triplicates.
Figure 2
Figure 2. BPI induces a p53 response in DLBCLs with wild type p53
Panel A: Ly4, Ly1, and Ly10 DLBCL cells were exposed to 5μM BPI for 48 hs and mRNA collected for QPCR determination of p53 transcript abundance of GADD45A (green line), PUMA (red line), NOXA (blue line), PIG3 (yellow line) and p21 (grey line) at the indicated time points. Results are expressed as fold of induction related to control peptide and normalized by GADPH. Panel B: The DLBCL cell lines Ly4, Ly1 and Ly10 cells were exposed to 5μM control peptide (white bar) or BPI (black bar) for 24 hours and the cell cycle distribution determined by Ki67/7-AAD FACS. The percent of cells at the respective stages of the cell cycle is represented by the Y-axis. Panel C: The Ly4, Ly1 and Ly10 cell lines were exposed to 5μM control peptide (white bar) or BPI (black bar) for 48h after which cell viability was determined by a tetrazolium compound assay (MTS). The percent of viable cells compared to control peptide is shown on the Y-axis. All of these experiments were performed in triplicates.
Figure 3
Figure 3. BPI induced p53 response plays a central role in killing p53 wild type DLBCL cells
Panel A: Ly4, Ly1, and Ly10 DLBCL cells were exposed to 5μM BPI or control peptide combined with the p53 inhibitor pifithrin-∝ (+) or vehicle for 12 hours and mRNA collected for RT-PCR determination of PIG3 (white bars) GADD45A (gray bars), and p21 (black bars) transcript abundance by RT-PCR. The Y-axis shows the fold induction of target gene mRNA in BPI vs. control peptide treated cells. Panel B: The Ly4, Ly1 and Ly10 cell lines were exposed to 5μM control peptide (white bar) or BPI (black bar) for 48h combined with the p53 inhibitor pifithrin-∝ (+) or vehicle after which cell viability was determined by MTS assays. The percent of viable cells compared to control peptide is shown on the Y-axis. Panel C: The Ly4, Ly1 and Ly10 cell lines were exposed to 5μM control peptide (white bar) or BPI (black bar) for 48h either 10 μM of a p53-dominant negative peptide or p53-control peptide as indicated after which cell viability was determined by MTS assays. The percent of viable cells compared to control peptide is shown on the Y-axis. All of these experiments were performed in triplicates.
Figure 4
Figure 4. BCL6 inhibition plus p53 activation cooperates to kill DLBCL cells
Panel A: Ly4, Ly1, and Ly10 DLBCL cells were exposed to 10μM p53C’-TAT peptide or p53 control peptide for 48 hs and mRNA collected at the indicated time points for RT-PCR determination of p53 transcript abundance of GADD45A (green line), PUMA (red line), NOXA (blue line), PIG3 (yellow line) and p21 (grey line). Results are expressed as fold of induction related to control peptide and normalized by GADPH. Panel B: Ly4, Ly1, and Ly10 DLBCL cells were exposed to 5μM BPI+ 10μM p53C’-TAT vs. the respective control combinations for 12 hours. mRNA was collected and transcript abundance of GADD45A (green line), PUMA (red line), NOXA (blue line), PIG3 (yellow line) and p21 (grey line) detected by QPCR. The results were normalized by GADPH and expressed as a combination index (CI = (fold increase of mRNA by BPI + fold increase of mRNA by p53C’-TAT) / fold mRNA increase BPI + p53C’-TAT), calculated as respective to control peptides (CP and P53-CP for BPI and P53-AP respectively). Panel C: The indicated DLBCL cells were exposed sequentially to the following combination of peptides i) 5μM BPI control peptide followed 24 hours later by 10μM p53 control peptide (white bars), ii) 5μM BPI control peptide followed 24 hs later by 10μM p53C’-TAT (light gray), iii) 5μM BPI followed 24 hs later by 10μM p53 control peptide (dark gray) or iv) 5μM BPI followed 24hs later by 10μM p53C’-TAT (black) . Cell viability determined at 48h by MTS assay. All of these experiments were performed in triplicates.
Figure 5
Figure 5. BPI and p53 restoration can induce different types of cell death
Panel A: Ly4, Ly1 and Ly10 cells treated for 24 h with control peptides (first row), 10μM p53C’-TAT (second row), 5μM BPI (third row) or the combination of BPI and p53C’-TAT (fourth row) were examined (400x is shown) by OA/EB staining to categorize the morphological aspect of dead cells. In the EB/AO method, live cells exhibit a morphologically normal green nucleus, early apoptotic cells are smaller and have a bright green nucleus (indicating condensed or fragmented chromatin with intact plasma membrane), late apoptotic cells are smaller and display bright orange fragmented nucleus (indicating condensed chromatin and affected plasma membrane) while necrotic cells are larger and have a structurally normal orange nucleus (indicating cytoplasm swelling, non-condensed chromatin and rupture of the plasma membrane that can be lost in the late necrosis). EA: early apoptosis, LA: late apoptosis, N: necrosis, LN: late necrosis, V: viable, BN: bi-nucleated cell and D: cell debris. Percentages for each type of dead (necrotic or apoptotic-like in red and yellow respectively) and viable cells (green) from triplicates experiments are shown in the bars. Panel B: DNA fragmentation was measured by mono and oligonucleosome enrichment ([TreatedA405nm - A490nm / ControlA405nm - A490nm]×100) in the cytoplasmatic fraction of cells treated as above. Panel C: Caspases 7/3 activity measured by the cleavage of a specific profluorescent substrate in cells treated as above. The Y axis indicates the caspase 7/3 activity (Ex499nm / Em521nm) over cell number determined by multiplexing with a metabolic assay (Ex560nm / Em590nm). Panel D: Level of ATP in cells treated for 18h with control peptides (white), 10μM p53C’-TAT (light grey), 5μM BPI (dark grey) and the combination of BPI and p53C’-TAT (black). Western blot showing PARP (113 kD) and the major fragment of PARP (89 kD) resulting from caspases activity in cells treated as before. All of these experiments were performed in triplicates.
Figure 6
Figure 6. Co-targeting of BCL6 and p53 enhances anti-lymphoma activity
Panel A: PRIMA-1 dose-response curves for a panel of seven DLBCL cell lines. The effect (Y axis) was measured as percentage of cell number in PRIMA-1-treated cells compared to vehicle-treated cells (plotted on the left). Values of GI50 (bar represents 95% CI) for PRIMA-1 (plotted on the right). The cells are represented according to whether TP53 is mutated (closed symbols) or wild type (open symbols). Panel B: BCL6 dependent cells were exposed to a single dose of BPI 10μM or PRIMA-1 25 μM or both drugs during 48 h. Cell number measured by metabolic assay comparing treated cells to control cells is represented in the Y axis. Panel C: Caspase 7/3 activity was determined in the same panel of cells after 6 h and 18 h of exposure to BPI, PRIMA-1 or the combination. Panel D: Representation of the combination index values for the effect at 48 h for the sequence of BPI administered once at time 0 h followed by PRIMA-1 administered once at 24 h (black) or the sequence of PRIMA-1 administered once at time 0 h followed by BPI administered once at 24 h (white). A CI = 1 ± 0.1 was considered as additive, CI > 1.1 was considered as infra-additive and CI < 0.9 was considered as supra-additive. Each value represents the mean of triplicates experiments with S.E (bars). Values shown also in Supp Table 3.

Similar articles

Cited by

References

    1. Pasqualucci L, Bereschenko O, Niu H, et al. Molecular pathogenesis of non-Hodgkin's lymphoma: the role of Bcl-6. Leuk Lymphoma. 2003;44(Suppl 3):S5–12. - PubMed
    1. Cattoretti G, Pasqualucci L, Ballon G, et al. Deregulated BCL6 expression recapitulates the pathogenesis of human diffuse large B cell lymphomas in mice. Cancer Cell. 2005;7(5):445–55. - PubMed
    1. Baron BW, Anastasi J, Montag A, et al. The human BCL6 transgene promotes the development of lymphomas in the mouse. Proc Natl Acad Sci U S A. 2004;101(39):14198–203. - PMC - PubMed
    1. Phan RT, Dalla-Favera R. The BCL6 proto-oncogene suppresses p53 expression in germinal-centre B cells. Nature. 2004;432(7017):635–9. - PubMed
    1. Phan RT, Saito M, Basso K, Niu H, Dalla-Favera R. BCL6 interacts with the transcription factor Miz-1 to suppress the cyclin-dependent kinase inhibitor p21 and cell cycle arrest in germinal center B cells. Nat Immunol. 2005;6(10):1054–60. - PubMed

Publication types

MeSH terms