Distinct cellular and molecular mechanisms underlie functional remodeling of repolarizing K+ currents with left ventricular hypertrophy
- PMID: 18451341
- PMCID: PMC2653713
- DOI: 10.1161/CIRCRESAHA.107.170050
Distinct cellular and molecular mechanisms underlie functional remodeling of repolarizing K+ currents with left ventricular hypertrophy
Abstract
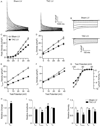
Left ventricular hypertrophy (LVH) is associated with electric remodeling and increased arrhythmia risk, although the underlying mechanisms are poorly understood. In the experiments here, functional voltage-gated (Kv) and inwardly rectifying (Kir) K(+) channel remodeling was examined in a mouse model of pressure overload-induced LVH, produced by transverse aortic constriction (TAC). Action potential durations (APDs) at 90% repolarization in TAC LV myocytes and QT(c) intervals in TAC mice were prolonged. Mean whole-cell membrane capacitance (C(m)) was higher, and I(to,f), I(K,slow), I(ss), and I(K1) densities were lower in TAC, than in sham, LV myocytes. Although the primary determinant of the reduced current densities is the increase in C(m), I(K,slow) amplitudes were decreased and I(ss) amplitudes were increased in TAC LV cells. Further experiments revealed regional differences in the effects of LVH. Cellular hypertrophy and increased I(ss) amplitudes were more pronounced in TAC endocardial LV cells, whereas I(K,slow) amplitudes were selectively reduced in TAC epicardial LV cells. Consistent with the similarities in I(to,f) and I(K1) amplitudes, Kv4.2, Kv4.3, and KChIP2 (I(to,f)), as well as Kir2.1 and Kir2.2 (I(K1)), transcript and protein expression levels were similar in TAC and sham LV. Unexpectedly, expression of I(K,slow) channel subunits Kv1.5 and Kv2.1 was increased in TAC LV. Biochemical experiments also demonstrated that, although total protein was unaltered, cell surface expression of TASK1 was increased in TAC LV. Functional changes in repolarizing K(+) currents with LVH, therefore, result from distinct cellular (cardiomyocyte enlargement) and molecular (alterations in the numbers of functional channels) mechanisms.
Figures


Comment in
-
Effects of heart disease on cardiac ion current density versus current amplitude: important conceptual subtleties in the language of arrhythmogenic ion channel remodeling.Circ Res. 2008 Jun 6;102(11):1298-300. doi: 10.1161/CIRCRESAHA.108.178087. Circ Res. 2008. PMID: 18535265 No abstract available.
Similar articles
-
Early remodeling of repolarizing K+ currents in the αMHC403/+ mouse model of familial hypertrophic cardiomyopathy.J Mol Cell Cardiol. 2017 Feb;103:93-101. doi: 10.1016/j.yjmcc.2017.01.006. Epub 2017 Jan 13. J Mol Cell Cardiol. 2017. PMID: 28089740 Free PMC article.
-
Heterogeneous expression of repolarizing, voltage-gated K+ currents in adult mouse ventricles.J Physiol. 2004 Aug 15;559(Pt 1):103-20. doi: 10.1113/jphysiol.2004.063347. Epub 2004 Jun 11. J Physiol. 2004. PMID: 15194740 Free PMC article.
-
Developmental analysis reveals mismatches in the expression of K+ channel alpha subunits and voltage-gated K+ channel currents in rat ventricular myocytes.J Gen Physiol. 1996 Nov;108(5):405-19. doi: 10.1085/jgp.108.5.405. J Gen Physiol. 1996. PMID: 8923266 Free PMC article.
-
PPARalpha-mediated remodeling of repolarizing voltage-gated K+ (Kv) channels in a mouse model of metabolic cardiomyopathy.J Mol Cell Cardiol. 2008 Jun;44(6):1002-1015. doi: 10.1016/j.yjmcc.2008.03.023. Epub 2008 Apr 9. J Mol Cell Cardiol. 2008. PMID: 18482733 Free PMC article.
-
Palmitate attenuates myocardial contractility through augmentation of repolarizing Kv currents.J Mol Cell Cardiol. 2010 Feb;48(2):395-405. doi: 10.1016/j.yjmcc.2009.10.004. Epub 2009 Oct 24. J Mol Cell Cardiol. 2010. PMID: 19857498 Free PMC article.
Cited by
-
Beat-to-beat spatiotemporal variability in the T vector is associated with sudden cardiac death in participants without left ventricular hypertrophy: the Atherosclerosis Risk in Communities (ARIC) Study.J Am Heart Assoc. 2015 Jan 19;4(1):e001357. doi: 10.1161/JAHA.114.001357. J Am Heart Assoc. 2015. PMID: 25600143 Free PMC article.
-
Risk stratification of sudden cardiac death in hypertension.J Electrocardiol. 2017 Nov-Dec;50(6):798-801. doi: 10.1016/j.jelectrocard.2017.08.012. Epub 2017 Aug 14. J Electrocardiol. 2017. PMID: 28916176 Free PMC article. Review.
-
Deleting the accessory subunit KChIP2 results in loss of I(to,f) and increased I(K,slow) that maintains normal action potential configuration.Heart Rhythm. 2009 Mar;6(3):370-7. doi: 10.1016/j.hrthm.2008.11.023. Epub 2008 Nov 27. Heart Rhythm. 2009. PMID: 19251214 Free PMC article.
-
Reduced Ventricular Arrhythmogeneity and Increased Electrical Complexity in Normal Exercised Rats.PLoS One. 2013 Jun 18;8(6):e66658. doi: 10.1371/journal.pone.0066658. Print 2013. PLoS One. 2013. PMID: 23825553 Free PMC article.
-
Mouse models of arrhythmogenic cardiovascular disease: challenges and opportunities.Curr Opin Pharmacol. 2014 Apr;15:107-14. doi: 10.1016/j.coph.2014.02.003. Epub 2014 Mar 13. Curr Opin Pharmacol. 2014. PMID: 24632325 Free PMC article. Review.
References
-
- Schoen FJ. The heart. In: Cotran RS, Kumar V, Collins T, editors. Robbin’s Pathologic Basis of Disease. Philadelphia, Pa: WB Saunders Co; 1999. pp. 543–599.
-
- McMullen JR, Jennings GL. Differences between pathological and physiological cardiac hypertrophy: novel therapeutic strategies to treat heart failure. Clin Exp Pharmacol Physiol. 2007;34:255–262. - PubMed
-
- Nattel S, Maguy A, Le Bouter S, Yeh YH. Arrhythmogenic ion-channel remodeling in the heart: heart failure, myocardial infarction, and atrial fibrillation. Physiol Rev. 2007;87:425–456. - PubMed
-
- Armoundas AA, Wu R, Juang G, Marban E, Tomaselli GF. Electrical and structural remodeling of the failing ventricle. Pharmacol Ther. 2001;92:213–230. - PubMed
-
- Kaab S, Nuss HB, Chiamvimonvat N, O’Rourke B, Pak PH, Kass DA, Marban E, Tomaselli GF. Ionic mechanism of action potential prolongation in ventricular myocytes from dogs with pacing-induced heart failure. Circ Res. 1996;78:262–273. - PubMed
Publication types
MeSH terms
Substances
Grants and funding
LinkOut - more resources
Full Text Sources
Other Literature Sources
Medical

