

How to perform meaningful estimates of genetic effects
- PMID: 18451979
- PMCID: PMC2320976
- DOI: 10.1371/journal.pgen.1000062
How to perform meaningful estimates of genetic effects
Abstract
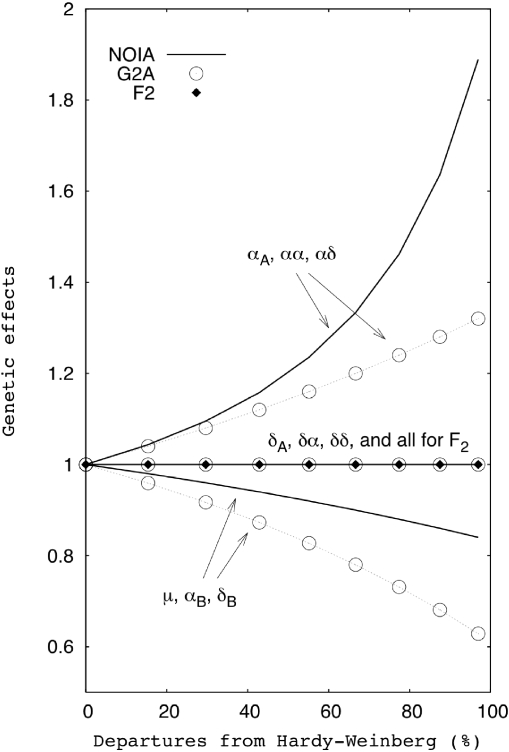
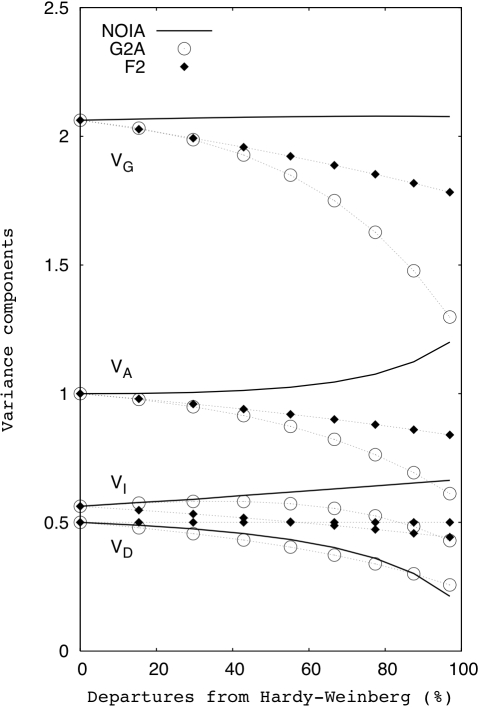
Although the genotype-phenotype map plays a central role both in Quantitative and Evolutionary Genetics, the formalization of a completely general and satisfactory model of genetic effects, particularly accounting for epistasis, remains a theoretical challenge. Here, we use a two-locus genetic system in simulated populations with epistasis to show the convenience of using a recently developed model, NOIA, to perform estimates of genetic effects and the decomposition of the genetic variance that are orthogonal even under deviations from the Hardy-Weinberg proportions. We develop the theory for how to use this model in interval mapping of quantitative trait loci using Halley-Knott regressions, and we analyze a real data set to illustrate the advantage of using this approach in practice. In this example, we show that departures from the Hardy-Weinberg proportions that are expected by sampling alone substantially alter the orthogonal estimates of genetic effects when other statistical models, like F2 or G2A, are used instead of NOIA. Finally, for the first time from real data, we provide estimates of functional genetic effects as sets of effects of natural allele substitutions in a particular genotype, which enriches the debate on the interpretation of genetic effects as implemented both in functional and in statistical models. We also discuss further implementations leading to a completely general genotype-phenotype map.
Conflict of interest statement
The authors have declared that no competing interests exist. The authors have declared that no competing interests exist.
Figures
References
-
- Carlborg Ö, Haley CS. Epistasis: too often neglected in complex trait studies? Nat Rev Genet. 2004;5:618–625. - PubMed
-
- Hansen TF. The evolution of genetic architecture. Annual Review of Ecology, Evolution and Systematics. 2006;37:123–157.
-
- Lynch M, Walsh B. Genetics and Analysis of Quantitative Traits. Sunderland: Sinauer; 1998.
Publication types
MeSH terms
LinkOut - more resources
Full Text Sources
Molecular Biology Databases
Miscellaneous
