. 2008 Jun;118(6):2132-47.
doi: 10.1172/JCI31073.

Central insulin action regulates peripheral glucose and fat metabolism in mice

Affiliations

Central insulin action regulates peripheral glucose and fat metabolism in mice

Linda Koch et al. J Clin Invest. 2008 Jun.

Abstract

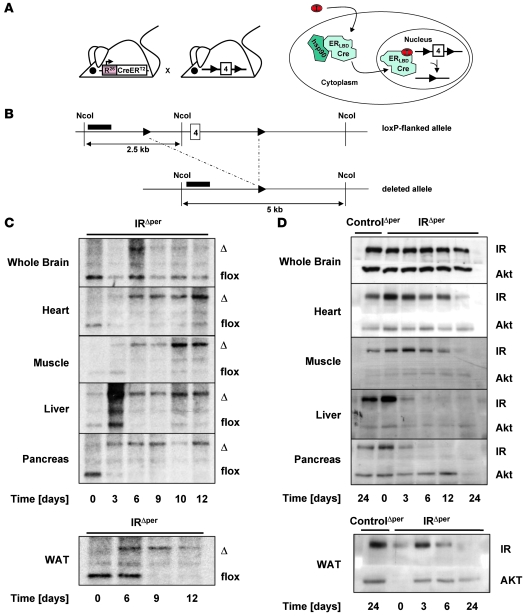
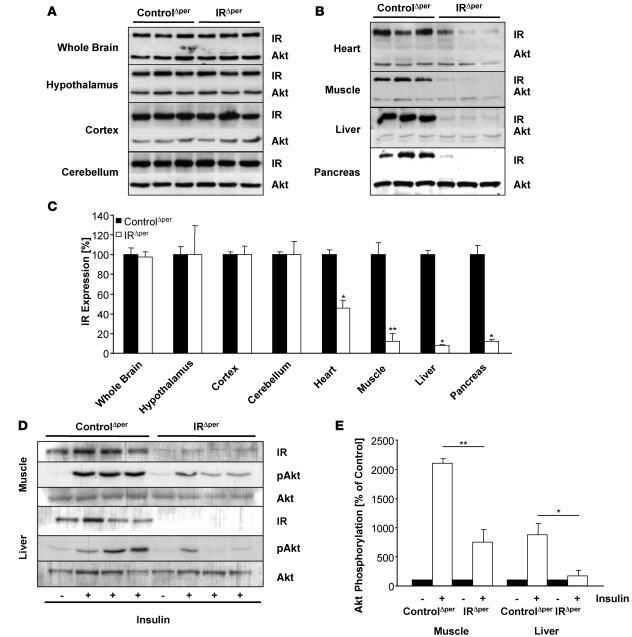
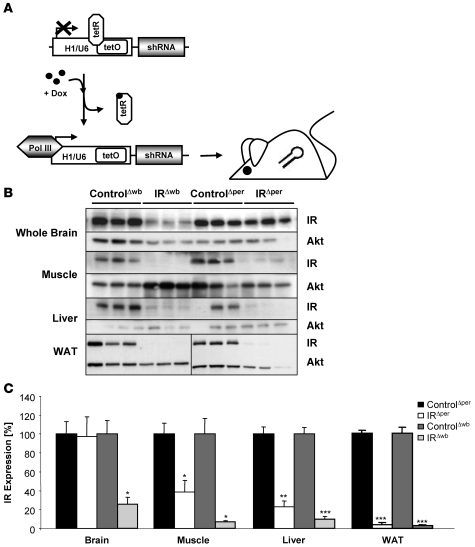
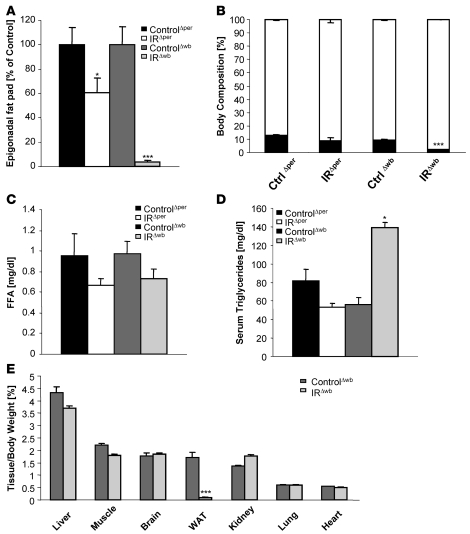
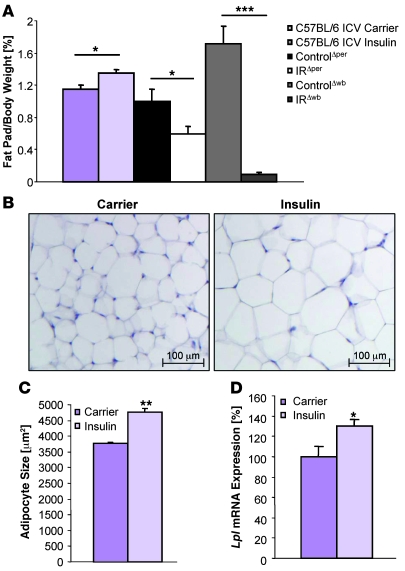
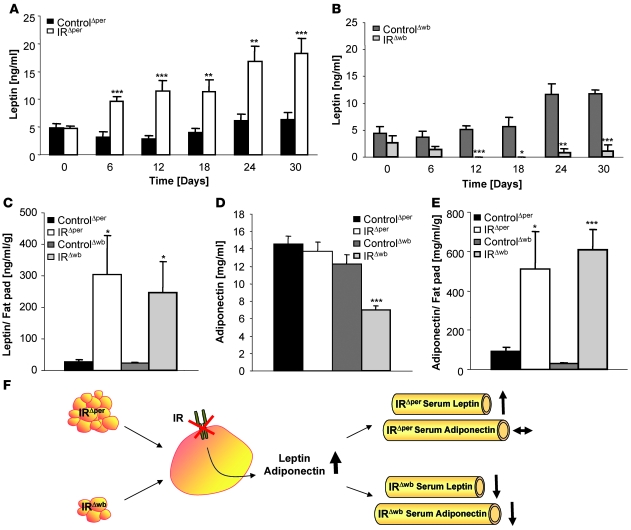
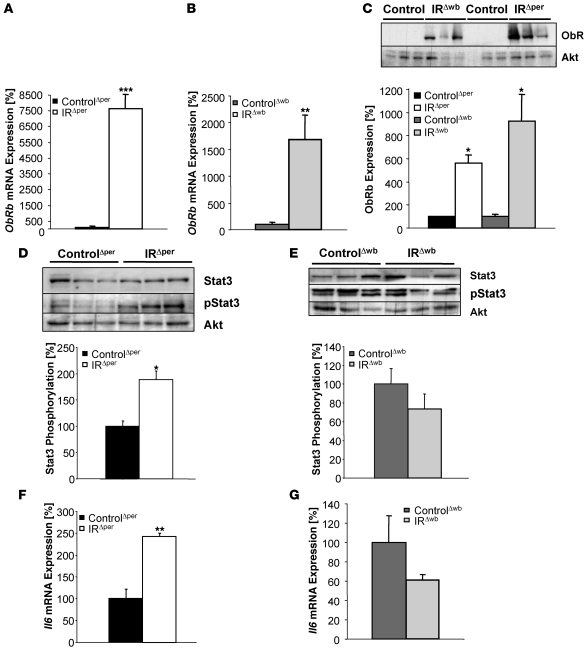
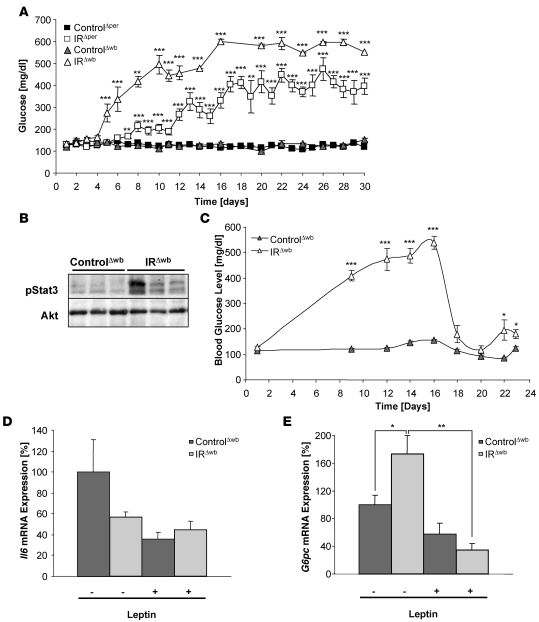
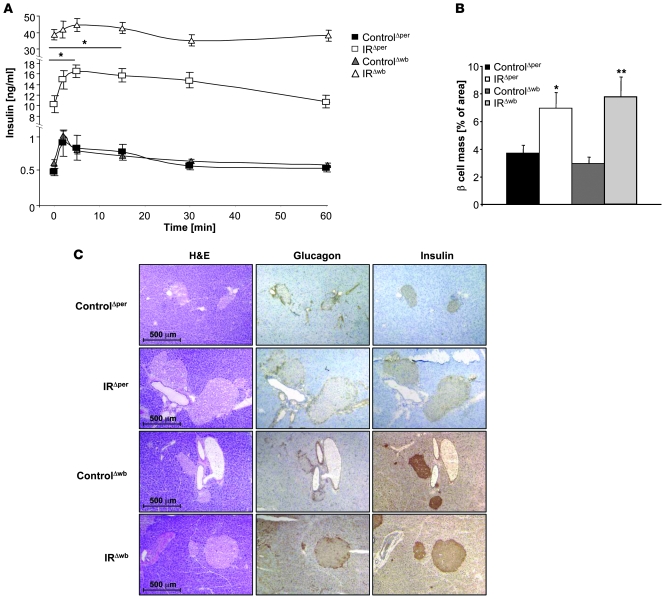
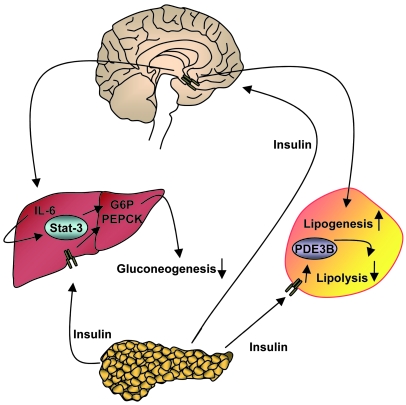
Insulin resistance is a hallmark of type 2 diabetes, and many insights into the functions of insulin have been gained through the study of mice lacking the IR. To gain a better understanding of the role of insulin action in the brain versus peripheral tissues, we created 2 mouse models with inducible IR inactivation, 1 in all tissues including brain (IRDeltawb), and 1 restricted to peripheral tissues (IRDeltaper). While downregulation of IR expression resulted in severe hyperinsulinemia in both models, hyperglycemia was more pronounced in IRDeltawb mice. Both strains displayed a dramatic upregulation of hepatic leptin receptor expression, while only IRDeltaper mice displayed increased hepatic Stat3 phosphorylation and Il6 expression. Despite a similar reduction in IR expression in white adipose tissue (WAT) mass in both models, IRDeltawb mice had a more pronounced reduction in WAT mass and severe hypoleptinemia. Leptin replacement restored hepatic Stat3 phosphorylation and normalized glucose metabolism in these mice, indicating that alterations in glucose metabolism occur largely as a consequence of lipoathrophy upon body-wide IR deletion. Moreover, chronic intracerebroventricular insulin treatment of control mice increased fat mass, fat cell size, and adipose tissue lipoprotein lipase expression, indicating that CNS insulin action promotes lipogenesis. These studies demonstrate that central insulin action plays an important role in regulating WAT mass and glucose metabolism via hepatic Stat3 activation.


Figures

Figure 1
Figure 1. Generation of IRΔper mice.
(A) General scheme of the inducible peripheral IR knockout mouse strain. Mice expressing a CreERT2 fusion protein under the control of the Rosa26 promoter were crossed with mice homozygous for the floxed IR allele. Binding of tamoxifen (T) to the mutated ligand binding domain of the ER (ERLBD) promotes a nuclear import of the fusion protein and results in the excision of exon 4 by the Cre recombinase. (B) Genomic map of the mouse IR locus surrounding exon 4. Location of the probe used for Southern blot analysis is indicated by black bars. NcoI, restriction enzyme sites; 4, exon 4 of the IR gene; 2.5 kb, size of floxed allele band; 5 kb, size of deleted allele band. (C) Southern blot analysis of IR deletion in whole brain, heart, skeletal muscle, liver, pancreas, and WAT of 12-week-old IRΔper mice over a period of 12 days. Day 1, beginning of tamoxifen treatment; Δ, 5-kb band of the deleted allele; flox, 2.5-kb band of the floxed allele. (D) Western blot analysis of IR and AKT (loading control) in whole brain, heart, skeletal muscle, liver, pancreas, and WAT of tamoxifen-treated 13-week-old IRΔper mice and control mice over a period of 24 days. Day 1, beginning of tamoxifen feeding.
Figure 2
Figure 2. IR expression and insulin-stimulated signaling in IRΔper mice.
(A) Western blot analysis of IR and AKT (loading control) in whole brain, hypothalamus, cortex, cerebellum, heart, skeletal muscle, liver, and pancreas of 14-week-old tamoxifen-treated IRΔper and ControlΔper mice. Indicated tissues were dissected 25 days after the last administration of tamoxifen. Animal groups comprised a minimum of 7 IRΔper and 9 ControlΔper mice, except for the western blot analysis in heart, which represents 5 IRΔper and 4 ControlΔper mice. (B) Comparative densitometric analysis of IR expression of 14-week-old ControlΔper (black bars) and IRΔper mice (white bars) of the western blot analysis shown in A. Values are mean ± SEM. *P ≤ 0.05; **P ≤ 0.01 versus control. (C) Western blot analysis of IR, pAKT, and AKT (loading control) in skeletal muscle and liver of 14-week-old ControlΔper and IRΔper mice injected with either saline (–) or insulin (+) into the vena cava inferior to assess remaining insulin signaling after IR deletion. Animal groups included 8 IRΔper and 8 ControlΔper mice. (D) Comparative densitometric analysis of pAKT of 14-week-old ControlΔper and IRΔper mice of the western blot analysis shown in C. pAKT protein amount was normalized to AKT protein expression. pAKT of saline-injected mice was set to 100%. Values are mean ± SEM. *P ≤ 0.05, **P ≤ 0.01 versus control. Black bars, saline; white bars, insulin.
Figure 3
Figure 3. Generation of IRΔwb mice.
(A) General scheme of the inducible whole body IR knockout mouse strain. Expression of an IR-specific shRNA is dependent on the RNA-polymerase III–dependent (Pol III–dependent) promoters H1/U6 containing the operator sequences (tetOs) of the E. coli tetracycline resistance operon. Binding of the tetracycline repressor (tetR) to tetO prevents transcription. Doxycycline (Dox) sequesters tetR and enables the binding of polymerase III to the H1/U6 promoter, which results in transcription of the shRNA. Binding of the shRNA to complementary mRNAs results in the degradation of the IR mRNA. (B) Western blot analysis of IR and AKT (loading control) in whole brain, skeletal muscle, liver, and WAT of 11- to 15-week-old ControlΔwb, IRΔwb, ControlΔper, and IRΔper mice. Tissues were dissected 30 days after the start of inducer administration, except for WAT of ControlΔwb and IRΔwb mice, which was extracted 7 days after start of doxycycline administration. Animal groups were comprised of 3-4 IRΔwb, 3–4 ControlΔwb, 7–15 IRΔper, and 9–17 ControlΔper mice. (C) Comparative densitometric analysis of IR expression of 11- to 15-week-old ControlΔper (black bars), IRΔper mice (white bars), ControlΔwb (dark gray bars), and IRΔwb mice (light gray bars) of the western blot analysis shown in B. Values are mean ± SEM. *P ≤ 0.05; **P ≤ 0.01; ***P ≤ 0.001 versus control. ANOVA values: brain, 0.027; muscle, 0.004; liver, 0.000; WAT, 0.000.
Figure 4
Figure 4. Central insulin resistance leads to a more severe lipodystrophy compared with peripheral insulin resistance.
(A) Average epigonadal fat pad weight of 14-week-old ControlΔper (black bars, n = 19), IRΔper (white bars, n = 18), ControlΔwb (dark gray bars, n = 18), and IRΔwb mice (light gray bars, n = 13) mice 30 days after start of inducer administration. Values are mean ± SEM. *P ≤ 0.05; ***P ≤ 0.001 versus control. ANOVA value: WAT, 0.000. (B) Body composition of 14-week-old ControlΔper (n = 9), IRΔper mice (n = 5), ControlΔwb (n = 8), and IRΔwb mice (n = 12) measured by nuclear magnetic resonance 30 days after start of inducer administration. Black bars indicate fat mass, white bars indicate lean mass. Values are mean ± SEM. ***P ≤ 0.001 versus control. (C) Free fatty acids of 14-week-old ControlΔper (black bars, n = 3), IRΔper (white bars, n = 4), ControlΔwb (dark gray bars, n = 10), and IRΔwb mice (light gray bars, n = 11) mice 7 days after start of inducer administration. Values are mean ± SEM. (D) Serum triglycerides of 14-week-old ControlΔper (black bars, n = 5), IRΔper (white bars, n = 7), ControlΔwb (dark gray bars, n = 5), and IRΔwb mice (light gray bars, n = 7) mice 7 days after start of inducer administration. Values are mean ± SEM. *P ≤ 0.05 versus control. (E) Tissue weight of liver, muscle, brain, WAT, kidney, lung, and heart correlated with body weight of 14-week-old ControlΔwb (n = 8–13) and IRΔwb mice (n = 8–16) 30 days after start of doxycycline administration. Values are mean ± SEM. ***P ≤ 0.001 versus control.
Figure 5
Figure 5. Chronic intracerebroventricular infusion of insulin induces lipogenesis in C57BL/6 mice.
(A) Epigonadal fat pad weight corrected for body weight of 11-week-old C57BL/6 mice receiving chronic intracerebroventricular infusion of carrier (dark purple bars, n = 5) or insulin solution (light purple bars, n = 5) at a rate of 200 μU/d over 7 days, and of 14-week-old ControlΔper (black bars, n = 19), IRΔper (white bars, n = 15), ControlΔwb (dark gray bars, n = 13), and IRΔwb mice (light gray bars, n = 16) mice 30 days after start of inducer administration. Values are mean ± SEM. *P ≤ 0.05; ***P ≤ 0.001. (B) H&E staining of WAT of 11-week-old C57BL/6 mice receiving a chronic intracerebroventricular infusion of carrier or insulin solution at a rate of 200 μU/d over 7 days. Magnification, ×100. (C) Mean adipocyte size of 11-week-old C57BL/6 mice receiving chronic intracerebroventricular infusion of carrier (dark purple bar, n = 3) or insulin solution (light purple bar, n = 3) at a rate of 200 μU/d over 7 days. Values are mean ± SEM. **P ≤ 0.01 versus control. (D) Relative mRNA expression of lipoprotein lipase (LPL) in WAT of 11-week-old C57BL/6 mice receiving chronic intracerebroventricular infusion of carrier (dark purple bar, n = 5) or insulin solution (light purple bar, n = 5) at a rate of 200 μU/d over 7 days. Values are mean ± SEM. *P ≤ 0.05 versus control.
Figure 6
Figure 6. Insulin inhibits cell-autonomous leptin secretion.
(A) Serum leptin levels of 14-week-old ControlΔper (n = 18) and IRΔper mice (n = 18) over a period of 30 days. Values are mean ± SEM. **P ≤ 0.01, ***P ≤ 0.001 versus control. (B) Serum leptin levels of 14-week-old ControlΔwb (n = 5) and IRΔwb mice (n = 5) over the course of 30 days. Values are mean ± SEM. *P ≤ 0.05, **P ≤ 0.01, ***P ≤ 0.001 versus control. (C) Serum leptin levels correlated with epigonadal fat pad weight of 14-week-old ControlΔper (black bar; n = 17), IRΔper (white bar; n = 13), ControlΔwb (dark gray bar; n = 13), and IRΔwb mice (light gray bar; n = 6). Concentrations were measured 30 days after start of tamoxifen or doxycycline administration. Values are mean ± SEM. *P ≤ 0.05 versus control. (D) Serum adiponectin levels of 14-week-old ControlΔper (black bar; n = 13), IRΔper (white bar; n = 8), ControlΔwb (dark gray bar; n = 13), and IRΔwb mice (light gray bar; n = 18). Samples were taken 30 days after start of tamoxifen or doxycycline administration. Values are mean ± SEM. ***P ≤ 0.001 versus control. (E) Serum adiponectin levels correlated with epigonadal fat pad weight of 14-week-old ControlΔper (black bar; n = 13), IRΔper (white bar; n = 10), ControlΔwb (dark gray bar; n = 13), and IRΔwb mice (light gray bar; n = 16). Samples were taken 30 days after start of tamoxifen or doxycycline administration. Values are mean ± SEM. *P ≤ 0.05; *P ≤ 0.001 versus control. (F) General scheme for the effects of insulin resistance on circulating leptin and adiponectin levels. As a result of the loss of peripheral IR signaling, leptin and adiponectin secretion is disinhibited, resulting in an increase in circulating concentrations, still detectable in the raised leptin levels of IRΔper mice. However, in IRΔwb mice this effect is masked by a dramatic reduction in WAT mass.
Figure 7
Figure 7. Effects of insulin resistance on leptin receptor expression, Stat3 phosphorylation, and Il6 mRNA expression in liver of 14-week-old IRΔper and IRΔwb mice.
Relative mRNA expression of hepatic ObRb of (A) ControlΔper (black bar; n = 8) and IRΔper (white bar; n = 7) mice and (B) ControlΔwb (dark gray bar; n = 5) and IRΔwb (light gray bar; n = 4) mice. (C) Western blot and densitometric analysis of hepatic ObRb and Akt (loading control) of ControlΔwb (n = 3), IRΔwb (n = 3), ControlΔper (n = 9), and IRΔper (n = 9) mice, with mean ObRb expression of controls set to 100%. (D) Western blot and densitometric analysis of hepatic Stat3, phosphorylated Stat3, and AKT of ControlΔper (n ≥ 6) and IRΔper (n ≥ 6) mice, with mean phosphorylated Stat3 in ControlΔper mice set to 100%. (E) Western blot and densitometric analysis of hepatic Stat3, phosphorylated Stat3, and Akt of ControlΔwb and IRΔwb mice, with mean phosphorylated Stat3 in ControlΔwb mice set to 100%. n ≥ 3 mice per group for Stat3 and n ≥ 7 mice per group for phosphorylated Stat3 analysis. Relative mRNA expression of hepatic Il6 in (F) ControlΔper (black bar; n = 8) and IRΔper (white bar; n = 7) mice and (G) ControlΔwb (dark gray bar; n = 7) and IRΔwb (light gray bar; n = 7) mice. Samples were collected 30 days after starting each experiment. Values are mean ± SEM. *P ≤ 0.05, **P ≤ 0.01, ***P ≤ 0.001 versus control.
Figure 8
Figure 8. Restoration of Stat3 phosphorylation in IRΔwb mice ameliorates hyperglycemia.
(A) Random fed blood glucose concentrations of 14-week-old ControlΔper (filled squares; n = 3–50), IRΔper (open squares; n = 3–48), ControlΔwb (filled triangles; n = 5–27) and IRΔwb mice (open triangles; n = 5–32) over 30 days. Data represent the mean ± SEM. **P ≤ 0.01, ***P ≤ 0.001 versus control. (B) Western blot analysis of phosphorylated Stat3 and AKT (loading control) in liver of 13-week-old ControlΔwb and IRΔwb mice receiving a chronic infusion of leptin at a rate of 12 μg per day. Tissues were excised 7 days after the subcutaneous implantation of an osmotic mini-pump. (C) Random fed blood glucose concentrations of 13-week-old ControlΔwb (filled triangles; n = 5) and IRΔwb mice (open triangles; n = 5) receiving a chronic infusion of leptin at a rate of 12 μg per day from day 16 onward. Data represent the mean ± SEM. *P ≤ 0.05, ***P ≤ 0.001 versus control. (D) Relative mRNA expression of Il6 in liver of 14-week-old ControlΔwb (dark gray bars; n = 5) and IRΔwb (light gray bars; n = 5) mice before (–) and after (+) chronic infusion of leptin at a rate of 12 μg per day over 7 days. Values are means ± SEM. (E) Relative mRNA expression of glucose-6-phosphatase (G6P) in liver of 14-week-old ControlΔwb (dark gray bars; n = 5) and IRΔwb (light gray bars; n = 5) mice before (–) and after (+) chronic infusion of leptin at a rate of 12 μg per day over 7 days. Values are mean ± SEM. *P ≤ 0.05, **P ≤ 0.01 versus control.
Figure 9
Figure 9. Plasma insulin levels and glucose-stimulated insulin secretion in IRΔper and IRΔwb mice.
(A) Glucose-stimulated insulin secretion of 13-week-old ControlΔper (filled squares; n = 8), IRΔper (open squares; n = 5), ControlΔwb (filled triangles; n = 5), and IRΔwb mice (open triangles; n = 8) on day 18. Values are mean ± SEM. *P ≤ 0.05 versus 0 min. (B) Percentage of β cell mass in 14-week-old ControlΔper (black bars; n = 4), IRΔper mice (white bars; n = 4), ControlΔwb (dark gray bars; n = 3), and IRΔwb mice (light gray bars; n = 3). Data was collected 30 days after starting the experiment. Values are mean ± SEM. *P ≤ 0.05, **P ≤ 0.01 versus control. (C) Immunohistochemical stainings of pancreatic islets in 14-week-old ControlΔper, IRΔper, ControlΔwb, and IRΔwb mice. Pancreatic tissues were stained for H&E, insulin, and glucagon. Magnification, ×100.
Figure 10
Figure 10. Proposed model for insulin action in the CNS and in the periphery in the regulation of glucose and adipose tissue metabolism.
Insulin is secreted from the pancreas and binds directly to IRs on peripheral organs such as liver and adipose tissue, thereby mediating signals leading to the downregulation of gluconeogenesis and lipolysis. By binding and activating IRs in the CNS, insulin action ultimately leads to the activation of hepatic Il6 and the upregulation of lipogenic genes in WAT.

References

    1. Lillioja S., et al. Insulin resistance and insulin secretory dysfunction as precursors of non-insulin-dependent diabetes mellitus. Prospective studies of Pima Indians. N. Engl. J. Med. 1993;329:1988–1992. doi: 10.1056/NEJM199312303292703. - DOI - PubMed
    1. Martin B.C., et al. Role of glucose and insulin resistance in development of type 2 diabetes mellitus: results of a 25-year follow-up study. Lancet. 1992;340:925–929. doi: 10.1016/0140-6736(92)92814-V. - DOI - PubMed
    1. Saltiel A.R., Kahn C.R. Insulin signalling and the regulation of glucose and lipid metabolism. Nature. 2001;414:799–806. doi: 10.1038/414799a. - DOI - PubMed
    1. Nigro J., Osman N., Dart A.M., Little P.J. Insulin resistance and atherosclerosis. Endocr. Rev. 2006;27:242–259. doi: 10.1210/er.2005-0007. - DOI - PubMed
    1. Plum L., Belgardt B.F., Bruning J.C. Central insulin action in energy and glucose homeostasis. J. Clin. Invest. 2006;116:1761–1766. doi: 10.1172/JCI29063. - DOI - PMC - PubMed

Publication types