Case Reports
. 2008 Jun;118(6):2157-68.
doi: 10.1172/JCI34438.

GLUT1 mutations are a cause of paroxysmal exertion-induced dyskinesias and induce hemolytic anemia by a cation leak

Affiliations
Case Reports

GLUT1 mutations are a cause of paroxysmal exertion-induced dyskinesias and induce hemolytic anemia by a cation leak

Yvonne G Weber et al. J Clin Invest. 2008 Jun.

Abstract

Paroxysmal dyskinesias are episodic movement disorders that can be inherited or are sporadic in nature. The pathophysiology underlying these disorders remains largely unknown but may involve disrupted ion homeostasis due to defects in cell-surface channels or nutrient transporters. In this study, we describe a family with paroxysmal exertion-induced dyskinesia (PED) over 3 generations. Their PED was accompanied by epilepsy, mild developmental delay, reduced CSF glucose levels, hemolytic anemia with echinocytosis, and altered erythrocyte ion concentrations. Using a candidate gene approach, we identified a causative deletion of 4 highly conserved amino acids (Q282_S285del) in the pore region of the glucose transporter 1 (GLUT1). Functional studies in Xenopus oocytes and human erythrocytes revealed that this mutation decreased glucose transport and caused a cation leak that alters intracellular concentrations of sodium, potassium, and calcium. We screened 4 additional families, in which PED is combined with epilepsy, developmental delay, or migraine, but not with hemolysis or echinocytosis, and identified 2 additional GLUT1 mutations (A275T, G314S) that decreased glucose transport but did not affect cation permeability. Combining these data with brain imaging studies, we propose that the dyskinesias result from an exertion-induced energy deficit that may cause episodic dysfunction of the basal ganglia, and that the hemolysis with echinocytosis may result from alterations in intracellular electrolytes caused by a cation leak through mutant GLUT1.


Figures

Figure 1
Figure 1. Clinical data of family PED1.
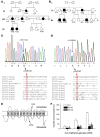
(A) Pedigree with clinical and genetic status. +/m, individuals carrying the Q282_S285del mutation (see Figure 2); +/+, individuals with 2 WT alleles of SLC2A1. An arrow marks the index patient. (B) Wet blood smears from a normal control and the index patient. Scale bar: 20 μm. (C) Electron microscopy showing 2 states of echinocytes from the index patient. Scale bar: 2 μm. (D) Quantitative analysis of echinocytes from 132 controls, 11 unaffected family members, and the 4 patients. All echinocyte counts from patients were above the normal value (6.3%, dashed line). (E) Compared with 10 controls, [Na+]i was increased and [K+]i decreased in erythrocytes from patients (P < 1 × 10⁻¹⁰). Individual values for patients and mean ± SEM are shown (D and E).
Figure 2
Figure 2. Genetic investigations.
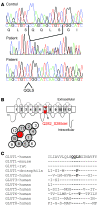
(A) Genomic sequences of a normal control (upper panel), the index patient (middle panel), and the cloned, mutant allele from the index patient (lower panel), revealing a 12-bp deletion at nucleotide 1,022 and loss of amino acids 282–285 (QQLS). The black line below the upper panel denotes the exact deleted region of the 12 bp. (B) Proposed structure of GLUT1 with 12 transmembrane segments (T1–12) and the location of Q282_S285del (red). A central pore (hatched region in the extracellular view) may be formed by segments marked in gray or red. (C) The deleted motif QQLS is highly conserved among species and other glucose transporters.
Figure 3
Figure 3. Functional studies.
(A) Reduced glucose uptake recorded in oocytes injected with mutant compared with WT cRNA. Shown are representative results recorded from 3 × 10 oocytes for each data point. *P < 0.05, **P < 0.01. (B) Glucose uptake as determined in 4 charges of erythrocytes from 3 patients of family PED1 carrying the Q282_S285del mutation (III-2, IV-1, IV-2; the index patient III-2 was measured twice and both of his sons once each) and in 10 charges from different normal controls. Plotted is the logarithm ln(1 – ct/ceq), with ct being the assimilated radioactivity after time t and ceq the 1 in the equilibrium (after 25 min), versus time yielding a linear function. The mean slope values of the linear fits in controls were –0.0280 ± 0.0018 s–1 and in patients –0.0201 ± 0.0006 s–1 (P < 0.05). Error bars are smaller than symbol size for the patients. (C and D) Using ion-selective electrodes, [Na+]i and [K+]i were recorded in oocytes, injected as indicated. [Na+]i was increased and [K+]i decreased for mutant compared with WT transporters. n = 6 for each group; P < 1 × 10⁻⁶ (mutant versus WT), P < 1 × 10⁻⁷ (mutant versus H2O) (C); n = 4–5, P < 0.001 (mutant versus both WT and H2O) (D). P values were calculated based on the potential differences between the ion-selective electrode and the conventional electrode. Therefore, error bars are not shown for the calculated ionic concentrations (see Supplemental Methods). (E) 86Rb+ flux experiments in oocytes show increased values for the mutation compared with the WT. Shown are values from 3 × 8 oocytes for each condition. **P < 0.01. (F) Increased 86Rb+ flux was also demonstrated in erythrocytes from 3 patients (III-2, IV-1, IV-2) compared with erythrocytes from 11 normal controls. ***P < 0.001. Representative experiments from individual batches of oocytes are shown (A and C–E). Individual values (C–F) and mean ± SEM (error bars in A, B, E, and F) are presented.
Figure 4
Figure 4. Functional analysis of the cation leak in erythrocytes from patients of family PED1.
(A and B) Representative whole-cell current traces recorded from erythrocytes of a control (A) and a patient (B) with Na-gluconate in the pipette and NaCl in the bath solution (left panel) and after isoosmotic replacement of NaCl by n-methyl-d-glucamine–chloride (NMDG-Cl) in the bath (right panel). (C and D) Mean current-voltage (I-V) relationships (± SEM) for control (C) (n = 3–4) and patients’ erythrocytes (D) (n = 5–6) recorded as in A and B with NaCl bath solution (open circles) and after isoosmotic replacement of NaCl by NMDG-Cl (closed triangles), CaCl2 (open diamonds), or KCl (open triangles) in the bath. In patients’ erythrocytes (D), the reversal potential of the I-V curve shifted by –30 ± 4, –20 ± 2, and +11 ± 2 mV (mean ± SEM; n = 5–6) from that recorded in NaCl solution following substitution with NMDG-Cl, CaCl2, and KCl, respectively. (E) Histogram recorded by flow cytometry in erythrocytes from controls (black line) and patients (red line) incubated in Ca2+-containing NaCl solution, depicting the fluo3 fluorescence intensity as a measure of the steady-state intracellular ([Ca2+]i). (F and G) Histograms (F) and time course (G) of changes in fluo3 fluorescence intensity of control (black line in F; open circles in G) and patients’ erythrocytes (red line in F; close triangles in G) following Ca2+ depletion by incubation for 30 minutes in Ca2+-free NaCl solution (F, left panel, and G, 0-minute values) and Ca2+ repletion (F, middle panel, and G). As a positive control experiment, the histogram in (F, right panel) shows the fluo3 fluorescence of Ca2+-permeabilized erythrocytes from controls (black line) and patients (red line) indicating equal fluo3 dye loading of both cell populations under these conditions (mean values ± SEM, 49 ± 8 and 55 ± 8 relative fluorescence units in erythrocytes from controls and patients, respectively; n = 4). The data in G are averaged geometrical means (± SEM; n = 14–16) of the fluorescence distribution. Lines represent exponential fits yielding the time constant of [Ca2+]i repletion (controls, τ = 16.3 ± 3.4 min; patients, τ = 7.1 ± 1.6 min; n = 14–16, P < 0.05; 2-tailed Welch-corrected t test).
Figure 5
Figure 5. Genetic and functional analysis of further families with PED.
(A) Partial pedigree of family PED2 (see ref. for full pedigree). Individuals affected by PED, epilepsy, mild mental retardation, and impulsivity are shown as filled symbols, and open symbols represent unaffected individuals. Symbols with diagonal lines represent deceased individuals. (B) Pedigree of family PED4 (modified after ref. ; see text). Filled symbols denote individuals affected by PED. +/+ denotes 2 WT alleles, whereas +/m denotes heterozygous mutation carriers. (C and D) DNA sequences shown for patients III-5 from family PED2 and II-7 from PED4 reveal point mutations c.G1119A (C) and c.G1002A (D), predicting the substitutions p.G314S and p.A275T, respectively. Lower panels show G314 is highly, while A275 is a bit less, conserved among species and other glucose transporters. (E) Localization of the 2 novel mutations in transmembrane domains 7 and 8 of GLUT1. (F) Glucose uptake in oocytes was reduced for both mutations (shown are representative results recorded from 1 batch of 3 × 10 oocytes for each glucose concentration, mean ± SEM; #P < 0.01, P < 0.001).
Figure 6
Figure 6. Kinetics, protein stability, and trafficking of all 3 mutants compared with WT GLUT1 transporters.
(A) Kinetic analysis of glucose uptakes in oocytes (as shown in Figure 3A and Figure 5F) according to Lineweaver-Burk. Lines represent linear fits to the data points using the equation 1/V (1/[S]) = 1/Vmax + Km/Vmax × 1/[S], with [S] being the concentration of the substrate OMG and V being the uptake velocity in pmol/oocyte/min. The y-axis intercept equals 1/Vmax and the x-axis intercept represents –1/Km (see Supplemental Methods). Vmax was markedly reduced for all 3 mutations compared with the WT without obvious effects on Km. The following values were obtained: WT, Vmax = 213 ± 35 pmol/oocyte/min and Km = 13.7 ± 2.5 mM; Q282_S285del, Vmax = 37 ± 8 pmol/oocyte/min and Km = 13.0 ± 3.2 mM; G314S, Vmax = 49 ± 11 and Km = 15.5 ± 4.9 mM; A275T, Vmax = 35 ± 4 pmol/oocyte/min and Km = 13.0 ± 2.3 mM. (B) Western blots obtained from oocytes injected with equal amounts of cRNA showed a similar amount of protein for all mutations and the WT, but no respective band for oocytes injected with H2O as a negative control; α-tubulin was used as a loading control. (C) Immunocytochemical analysis of injected oocytes using an anti-GLUT1 antibody revealed similar stainings of the surface membranes for all 4 clones, suggesting a normal trafficking of the mutant proteins to the surface membrane. Scale bars: 100 μm.

Similar articles

Cited by

References

    1. Bhatia K.P. Familial (idiopathic) paroxysmal dyskinesias: an update. Semin. Neurol. 2001;21:69–74. doi: 10.1055/s-2001-13121. - DOI - PubMed
    1. Auburger G., et al. A gene for autosomal dominant paroxysmal choreoathetosis/spasticity (CSE) maps to the vicinity of a potassium channel gene cluster on chromosome 1p, probably within 2 cM between D1S443 and D1S197. Genomics. 1996;31:90–94. doi: 10.1006/geno.1996.0013. - DOI - PubMed
    1. Szepetowski P., et al. Familial infantile convulsions and paroxysmal choreoathetosis: a new neurological syndrome linked to the pericentromeric region of human chromosome 16. Am. J. Hum. Genet. 1997;61:889–898. doi: 10.1086/514877. - DOI - PMC - PubMed
    1. Guerrini R., et al. Autosomal recessive rolandic epilepsy with paroxysmal exercise-induced dystonia and writer‘s cramp: delineation of the syndrome and gene mapping to chromosome 16p12-11.2. Ann. Neurol. 1999;45:344–352. doi: 10.1002/1531-8249(199903)45:3<344::AID-ANA10>3.0.CO;2-9. - DOI - PubMed
    1. Lee M.S., Marsden C.D. Movement disorders following lesions of the thalamus or subthalamic region. Mov. Disord. 1994;9:493–507. doi: 10.1002/mds.870090502. - DOI - PubMed

Publication types