. 2008 Jun;47(6):1974-82.
doi: 10.1002/hep.22226.

Adoptive transfer of CD8(+) T cells from transforming growth factor beta receptor type II (dominant negative form) induces autoimmune cholangitis in mice

Affiliations

Adoptive transfer of CD8(+) T cells from transforming growth factor beta receptor type II (dominant negative form) induces autoimmune cholangitis in mice

Guo-Xiang Yang et al. Hepatology. 2008 Jun.

Abstract

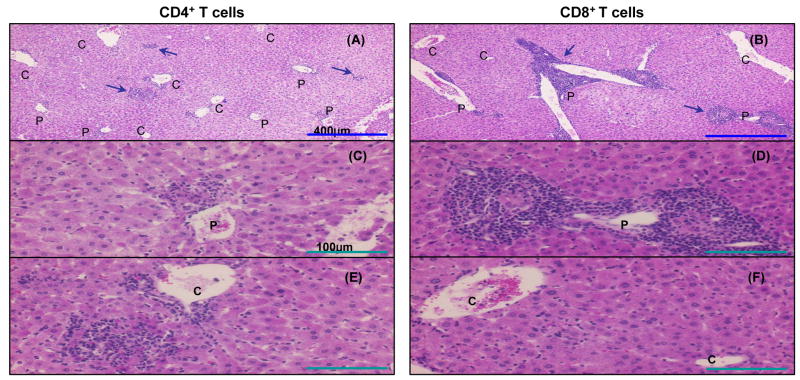
We recently reported that mice with a T cell-restricted expression of a dominant negative form of transforming growth factor beta receptor type II (dnTGFbetaRII) spontaneously develop autoimmune cholangitis that resembles human primary biliary cirrhosis (PBC), including antimitochondrial antibodies (AMAs) and extensive portal CD4(+) and CD8(+) lymphocytic infiltrates. On the basis of these data, we performed a series of experiments to determine whether the pathology was secondary to direct dnTGFbetaRII disruption of the liver and/or alternatively the appearance of autoreactive T cells. First, using dnTGFbetaRIIRag1(-/-) mice, we noted a normal hepatic and biliary structure. Hence, we performed a rigorous series of adoptive transfer studies, transferring Ly5.1(+) unfractionated spleen cell CD4(+) or CD8(+) T cells from dnTGFbetaRII mice into B6/Rag(-/-) (Ly 5.2) recipients. In unmanipulated dnTGFbetaRII mice, there was a marked increase in CD4(+) and CD8(+) T cell biliary infiltrates with AMA. Indeed, B6/Rag(-/-) recipients of dnTGFbetaRII unfractionated cells develop features of liver disease similar to PBC, suggesting that splenic loss of self-tolerance alone is sufficient to cause disease in this model and therefore that there is no specific abnormality in the biliary targets required for appearance of disease. More importantly, adoptive transfer of CD8(+) but not CD4(+) T cells into B6/Rag(-/-) mice led to liver histopathology remarkably similar to PBC, emphasizing a prominent role for CD8 T cell-mediated pathogenesis. In contrast, B6/Rag(-/-) recipients of CD4(+) T cells from dnTGFbetaRII mice predominantly developed inflammatory bowel disease associated with higher levels of serum interferon gamma and tumor necrosis factor alpha.

Conclusion: These data suggest that in this model of PBC, autoreactive CD8(+) cells destroy bile ducts.


Figures

Figure 1
Figure 1. T cell infiltration in dnTGFβRII mice
A. Lymphoid cells isolated from the liver of dnTGFβRII mice and control B6 mice at serial ages were stained with fluorochrome-conjugated mAbs (see Methods) and analyzed by flow cytometry. Total lymphoid cells (left panel) and the ratio of CD8+ T cell to CD4+ T cells (right panel) are shown. The data presented in the figure are the mean ± SD, with 4 to 8 mice at each time point. *, dnTGFβRII vs B6 mice, P<0.05. B. Immunohistochemical analysis of liver of dnTGFβRII mice at 20 weeks of age using mAbs to CD4 and CD8.
Figure 2
Figure 2. Splenocytes of dnTGFβRII mice can transfer liver disease to Rag1−/−recipient mice
B6/Rag1−/− (Ly5.2) mice received 1×10⁷ splenic lymphoid cells isolated from either dnTGFβRII (Ly5.1) or B6 Ly5.1 control mice. A. Data display the mean weight of 6 mice per group and are representative of 2 independent experiments. B. Total cell number of lymphoid cells isolated from liver and spleen of B6/Rag1−/− recipients 8 weeks after transfer. *, dnTGFβRII vs B6 mice, P<0.05. C. Quantification of anti-PDC-E2 in the sera of recipient mice 2 and 4 weeks after transfer of dnTGFβRII spleen cells.
Figure 3
Figure 3. dnTGFβRII splenic lymphoid cells induce inflammation in multiple organs of Rag1−/− recipient
B6/Rag1−/− (Ly5.2) mice received 1×10⁷ splenic lymphoid cells isolated from either dnTGFβRII (Ly5.1) or B6 Ly5.1 control mice. 6 weeks after transfer, recipients were sacrificed and liver, colon, and lung were fixed in 10 % formalin. Paraffin-embedded tissues were stained with H & E.
Figure 4
Figure 4. Absence of cell infiltration in naive dnTGFβRIIRag1−/− mice
dnTGFβRIIRag1−/− mice were generated by breeding dnTGFβRII mice with B6/Rag1−/− mice. These transgenic mice and control B6/Rag1−/− mice were sacrificed at 20 weeks of age. Tissues were fixed in 10 % formalin. Paraffin-embedded tissues were stained with H & E.
Figure 5
Figure 5. Characteristics of Rag1−/− mice transferred with dnTGFβRII CD4+ and CD8+ T cells
CD4+ and CD8+ T cells were isolated from spleen of dnTGFβRII (Ly5.1) mice by magnetic microbeads. Aliquots of 1×10⁶ CD4+ and CD8+ T cells were intravenously injected into B6/Rag1−/− (Ly5.2) mice. A. Body weight of recipients transferred with CD4+ or CD8+ T cells. The error bars represent the means ± SD. B. Survival of the recipients (%) transferred with CD4+ or CD8+ T cells. C. T cell numbers in liver of recipients transferred with CD4+ and CD8+ T cells. Recipients were sacrificed at 8 weeks after transfer. Liver lymphoid cells were stained with fluorochrome-conjugated mAbs and analyzed by flow cytometry. Absolute numbers of CD4+ or CD8+ T cells from donor are shown as the means ± SD. Each group included 6 to 8 mice. *, CD4 group vs CD8 group, p<0.05.
Figure 6
Figure 6. Serum cytokine profiles of mice transferred with dnTGFβRII CD4+ and CD8+ T cells
Sera were collected at various times after T cell transfer. Concentrations of IFN-γ and TNF-α were determined by CBA (see Materials and Methods). Each group included 4 to 6 mice. Data represent means ± SD.
Figure 7
Figure 7. Liver histological changes of recipient mice transferred with dnTGFβRII CD4+ and CD8+ T cells
B6/Rag1−/− (Ly5.2) mice received CD4+ or CD8+ T cells as described in Fig. 5; 8 weeks after transfer, recipients were sacrificed and liver tissues were stained with H & E. Representative photomicrographs of tissues are shown. A, C, E. Pattern of lymphoid cell infiltration in liver after transfer with CD4+ T cells. B, D, F. Pattern of lymphoid cell infiltration in liver after transfer with CD8+ T cells. Arrows show areas of inflammation in the liver. P, portal tract. C, central vein.
Figure 8
Figure 8. Histological changes of recipient mice transferred with dnTGFβRII CD4+ or CD8+ T cells
B6/Rag1−/− (Ly5.2) mice received CD4+ or CD8+ T cells as described in Fig. 5; 8 weeks after transfer, recipients were sacrificed and sections of lung and colon were stained with H & E. Representative photomicrographs illustrate inflammation affecting colon and lung of recipients transferred with different T cell subsets.

References

    1. Ueno Y, Moritoki Y, Shimosegawa T, Gershwin ME. Primary biliary cirrhosis: what we know and what we want to know about human PBC and spontaneous PBC mouse models. J Gastroenterol. 2007;42:189–195. - PubMed
    1. Kaplan MM, Gershwin ME. Primary biliary cirrhosis. N Engl J Med. 2005;353:1261–1273. - PubMed
    1. Chuang YH, Lian ZX, Cheng CM, Lan RY, Yang GX, Moritoki Y, Chiang BL, et al. Increased levels of chemokine receptor CXCR3 and chemokines IP-10 and MIG in patients with primary biliary cirrhosis and their first degree relatives. J Autoimmun. 2005;25:126–132. - PubMed
    1. Rieger R, Leung PS, Jeddeloh MR, Kurth MJ, Nantz MH, Lam KS, Barsky D, et al. Identification of 2-nonynoic acid, a cosmetic component, as a potential trigger of primary biliary cirrhosis. J Autoimmun. 2006;27:7–16. - PubMed
    1. Van de Water J, Fregeau D, Davis P, Ansari A, Danner D, Leung P, Coppel R, et al. Autoantibodies of primary biliary cirrhosis recognize dihydrolipoamide acetyltransferase and inhibit enzyme function. J Immunol. 1988;141:2321–2324. - PubMed

Publication types

MeSH terms

Substances