. 2008 Jun;68(6):1395-405.
doi: 10.1111/j.1365-2958.2008.06228.x. Epub 2008 Apr 29.

Localization and nucleotide specificity of Blastocystis succinyl-CoA synthetase

Affiliations

Localization and nucleotide specificity of Blastocystis succinyl-CoA synthetase

Karleigh Hamblin et al. Mol Microbiol. 2008 Jun.

Abstract

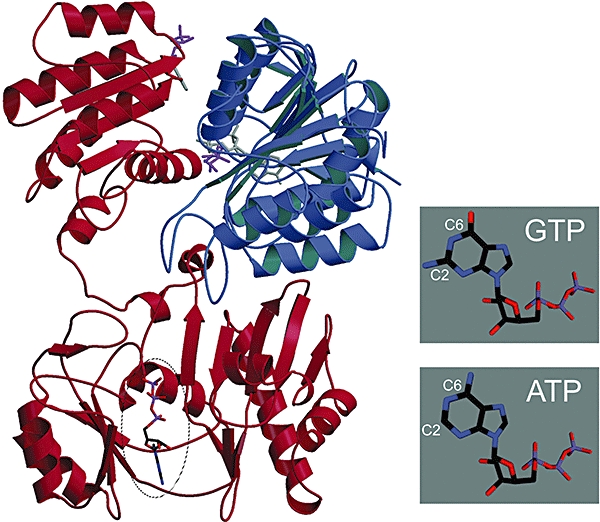
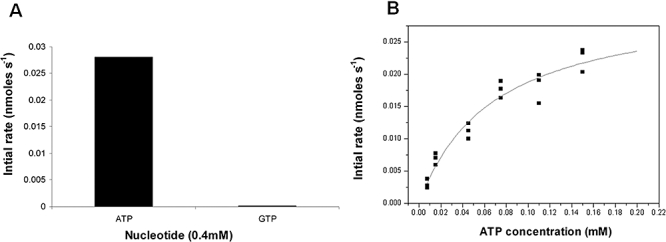
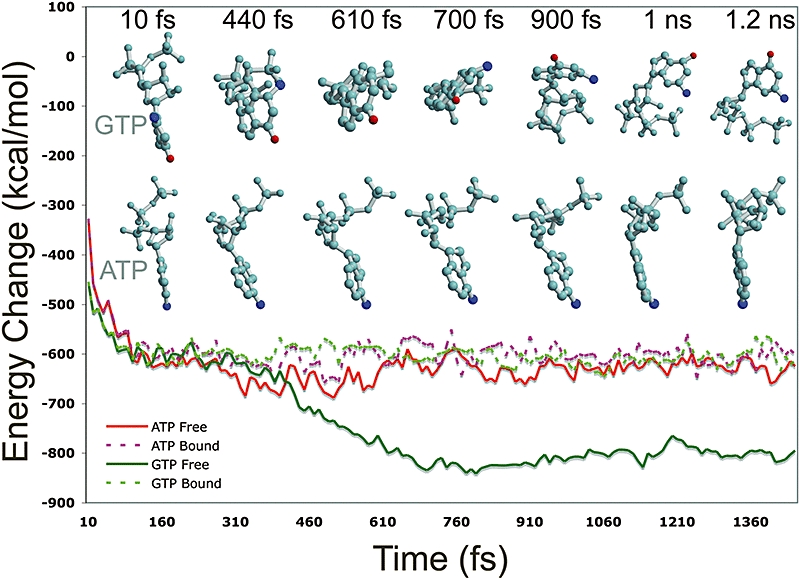
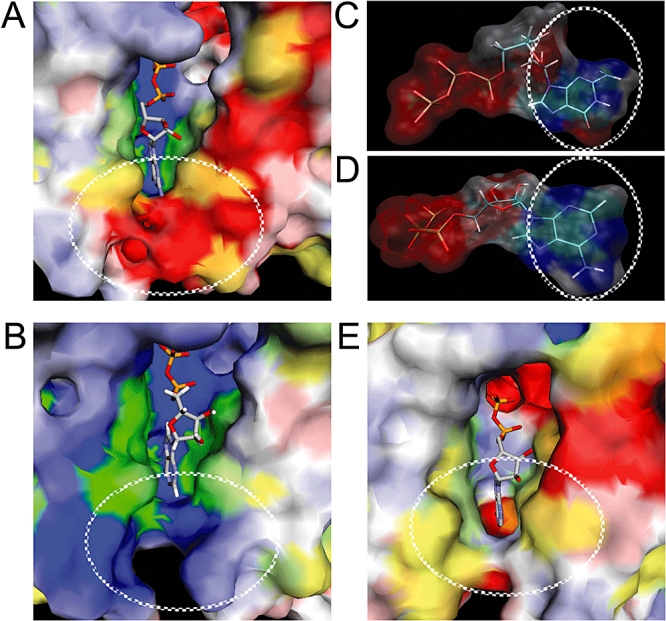
The anaerobic lifestyle of the intestinal parasite Blastocystis raises questions about the biochemistry and function of its mitochondria-like organelles. We have characterized the Blastocystis succinyl-CoA synthetase (SCS), a tricarboxylic acid cycle enzyme that conserves energy by substrate-level phosphorylation. We show that SCS localizes to the enigmatic Blastocystis organelles, indicating that these organelles might play a similar role in energy metabolism as classic mitochondria. Although analysis of residues inside the nucleotide-binding site suggests that Blastocystis SCS is GTP-specific, we demonstrate that it is ATP-specific. Homology modelling, followed by flexible docking and molecular dynamics simulations, indicates that while both ATP and GTP fit into the Blastocystis SCS active site, GTP is destabilized by electrostatic dipole interactions with Lys 42 and Lys 110, the side-chains of which lie outside the nucleotide-binding cavity. It has been proposed that residues in direct contact with the substrate determine nucleotide specificity in SCS. However, our results indicate that, in Blastocystis, an electrostatic gatekeeper controls which ligands can enter the binding site.


Figures

Fig. 1
Fig. 1
Structural model of Blastocystis SCS. The homology model of Blastocystis SCS, using pig SCS (PDB code 2fp4) as a template, is shown with the alpha subunit in blue and the beta subunit, containing the nucleotide-binding region, in crimson. The ligands GTP (surrounded by oval in bottom, front) and co-enzyme A (top, rear) are taken from the template and from E. coli SCS (PDB code 1jkj) respectively. The inset on the right shows GTP (top) and ATP (bottom) as stick figures, with carbons 2 and 6 on the 6-membered ring indicated. The figure was prepared using Molscript v2.1.2 (Kraulis, 1991) and Raster3 (Merritt and Bacon, 1997).
Fig. 2
Fig. 2
Localization of Blastocystis SCS. A. Western blot of Blastocystis whole-cell lysate (13.6 μg) probed with antiserum raised against pig SCSα indicating the specificity of the antiserum. A strong cross-reacting band of approximately 32.5 kDa is recognized, in agreement with the predicted molecular weight of 31.5 kDa. B. Coomassie-stained SDS polyacrylamide gel (left) showing the results of His-tag purification of Blastocystis SCS. Two major bands are present; a lower band of a size consistent with the His-tagged SCSα and a higher band with a size consistent with a S-tagged SCSβ. Probing of this sample with an S-protein antibody (right) confirmed that the higher band was indeed SCSβ, indicating that the two Blastocystis SCS subunits do interact. C. Intracellular distribution of Blastocystis SCS using confocal microscopy. Cells were double-labelled for SCS (left) and the mitochondrial marker MitoTracker (middle). SCS clearly colocalizes with MitoTracker (right).
Fig. 3
Fig. 3
Blastocystis SCS enzyme kinetics measured in the direction of succinyl-CoA formation. A. Comparison of the initial rate of SCS with ATP and GTP under standard assay conditions (Fraser et al., 2002). No detectable rate was seen for GTP. B. Michaelis–Menten plot for Blastocystis SCS in the presence of ATP. Graph shows the initial rate (nmol s−1) versus ATP concentration (mM). The Blastocystis SCS Km and Vmax were determined by curve fitting to the hyperbolic M-M equation, giving values of 68 μM and 32 nmol s−1 respectively.
Fig. 4
Fig. 4
Early stages of unbinding for ATP and GTP from Blastocystis SCS. Starting from the bound state, the first 1.5 ns of two MD simulations (Free and Bound) are shown for each nucleotide. In the Free simulation, the ligand was allowed to diffuse away from the receptor. In the Bound simulation, the ligand was restrained to its initial position by a harmonic penalty function, as described in Experimental procedures. The energy change was measured relative to the ligand-free receptor. Seven snapshots of the ligand trajectories were taken in the first 1.5 ns, illustrating the flipping of GTP. These snapshots were taken from the same viewpoint, with the receptor cavity located below the ligand, and were translated in order to fit into the figure. The figures were prepared using Molscript v2.1.2 (Kraulis, 1991) and Raster3 (Merritt and Bacon, 1997).
Fig. 5
Fig. 5
Electrostatic surfaces of nucleotide-binding region. The electrostatic surfaces of pig SCS (A) and Blastocystis SCS (B) are shown with the charged rim indicated by white ovals. Semi-transparent electrostatic surfaces of GTP (C) and ATP (D) are shown with the differing regions, where GTP possesses a dipole that is approximately orthogonal to the main dipole moment, indicated by a white dotted oval. For reference, the electrostatic surface of E. coli SCS is shown as well (E), with the neutral rim indicated by a white oval. The electrostatic surfaces were prepared using the eF-surf server (Kinoshita, 2006, http://ef-site.hgc.jp/eF-surf/) and eF-site (Kinoshita and Nakamura, 2004).

Similar articles

Cited by

References

    1. Basu G, Sivanesan D, Kawabata T, Go N. Electrostatic potential of nucleotide-free protein is sufficient for discrimination between adenine and guanine-specific binding sites. J Mol Biol. 2004;342:1053–1066. - PubMed
    1. Bridger WA, Ramaley RF, Boyer PD, John ML. Succinyl-coenzyme A synthetase from Escherichia coli. Methods Enzymol. 1969;13:70–75.
    1. Bridger WA, Wolodko WT, Henning W, Upton C, Majumdar R, Williams SP. The subunits of succinyl-coenzyme A synthetase – function and assembly. Biochem Soc Symp. 1987;54:103–111. - PubMed
    1. Castillo-Davis CI, Mekhedov SL, Hartl DL, Koonin EV, Kondrashov FA. Selection for short introns in highly expressed genes. Nat Genet. 2002;31:415–418. - PubMed
    1. Chen R, Greer A, Dean AM. Redesigning secondary structure to invert coenzyme specificity in isopropylmalate dehydrogenase. Proc Natl Acad Sci USA. 1996;93:12171–12176. - PMC - PubMed

Publication types

MeSH terms

Associated data