. 2008 Jul;99(7):1390-400.
doi: 10.1111/j.1349-7006.2008.00838.x. Epub 2008 Apr 29.

Frequent silencing of a putative tumor suppressor gene melatonin receptor 1 A (MTNR1A) in oral squamous-cell carcinoma

Affiliations

Frequent silencing of a putative tumor suppressor gene melatonin receptor 1 A (MTNR1A) in oral squamous-cell carcinoma

Erina Nakamura et al. Cancer Sci. 2008 Jul.

Abstract

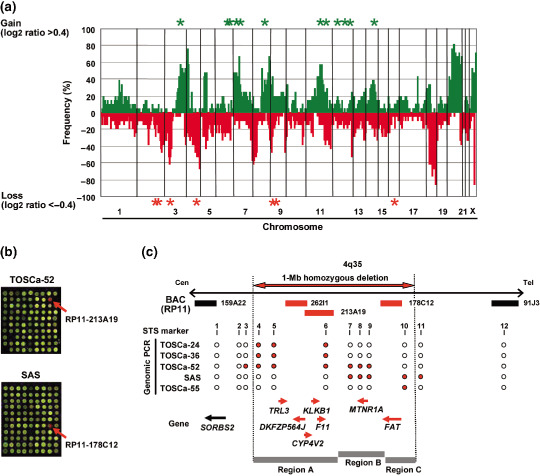
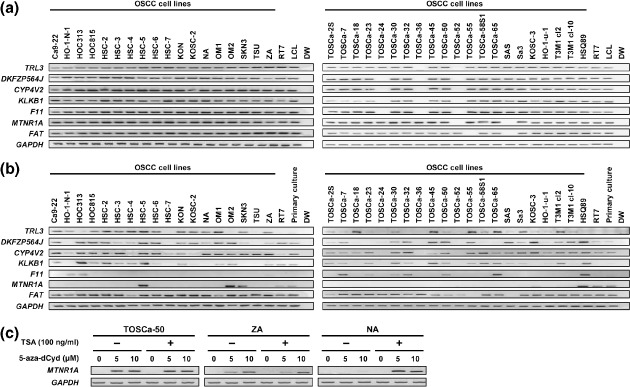
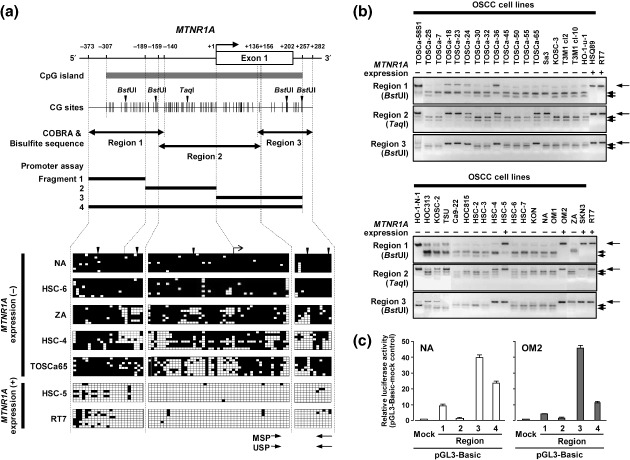
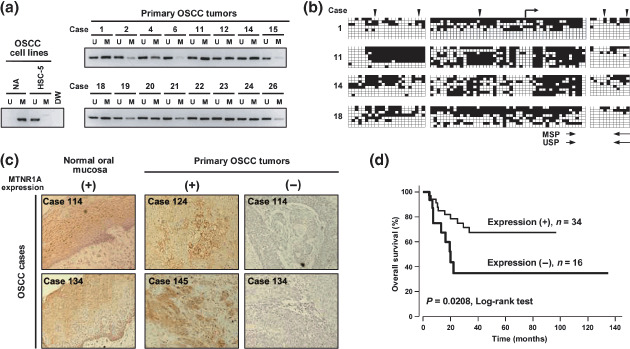
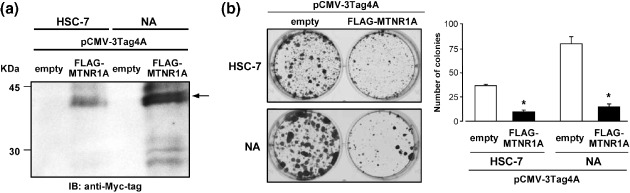
Array-based comparative genomic hybridization (array-CGH) has good potential for the high-throughput identification of genetic aberrations in cell genomes. In the course of a program to screen a panel of 21 oral squamous-cell carcinoma (OSCC) cell lines for genome-wide copy-number aberrations by array-CGH using our in-house bacterial artificial chromosome arrays, we identified a frequent homozygous deletion at 4q35 loci with approximately 1 Mb in extent. Among the seven genes located within this region, the expression of the melatonin receptor 1 A (MTNR1A) messenger RNA (mRNA) was not detected or decreased in 35 out of the 39 (89%) OSCC cell lines, but was detected in immortalized normal oral epithelial cell line, and was restored in gene-silenced OSCC cells without its homozygous loss after treatment with 5-aza-2'-deoxycytidine. The hypermethylation of the CpG (cytosine and guanine separated by phosphate) island in the promoter region of MTNR1A was inversely correlated with its expression in OSCC lines without a homozygous deletion. Methylation of this CpG island was also observed in primary OSCC tissues. In an immunohistochemical analysis of 50 primary OSCC tumors, the absence of immunoreactive MTNR1A was significantly associated with tumor size and a shorter overall survival in patients with OSCC tumors, and seems to be an independent prognosticator in a multivariate analysis. Exogenous restoration of MTNR1A expression inhibited the growth of OSCC cells lacking its expression. Together with the known tumor-suppressive function of melatonin and MTNR1A in various tumors, our results indicate MTNR1A to be the most likely target for epigenetic silencing at 4q35 and to play a pivotal role during oral carcinogenesis.


Figures

Figure 1
Figure 1
(a) Genome‐wide frequencies of copy‐number gains (above 0, green) and losses (below 0, red) detected by MCG Cancer Array‐800 in 21 oral squamous‐cell (OSCC) cell lines. Clones are ordered from chromosomes 1–22, X and Y and within each chromosome on the basis of the University of California Santa Cruz mapping position (http://genome.ucsc.edu/March, 2006 Assembly). Green asterisks (*), regions with high‐level amplification (log2 ratio  >2); red asterisks (*), regions with homozygous deletion (log2 ratio <–2) detected with either MCG Cancer Array‐800 or MCG Whole Genome Array‐4500. (b) Representative image of array‐based comparative genomic hybridization (MCG Whole Genome Array‐4500) of the TOSCa‐52 and SAS cell line. Remarkable decreases in copy‐number ratio (log2 ratio <–2) of RP11–213A19 in TOSCa‐52 and RP11–178C12 in SAS cells at 4q35 were detected as clear red signals (red arrows). (c) Map of 4q35 around the region homozygously deleted in the TOSCa‐24, 36, 52, 55, and SAS cell lines. Bacterial artificial chromosomes (BAC) spotted on the array are shown by horizontal bars; red bars, BACs with log2 ratio <–2 indicating homozygous deletion; black bars, BACs with log2 ratio  >–2 in these cell lines. The detailed mapping of homozygously deleted and retained regions in five cell lines was performed by genomic PCR using sequence‐tagged site markers (1, SHGC‐80058; 2, RH48688; 3, SHGC‐156018; 4, RH45826; 5, SGGC‐140659; 6, GDB:315917; 7, SHGC‐50729; 8, SHGC‐140376; 9, WI‐3160; 10, SHGC‐79933; 11, WI‐4200; and 12, RH42876). Homozygously deleted and retained regions are indicated as red closed and open circles, respectively. Three independent regions with homozygous deletion of more than one cell line (Regions a–c) were detected among five cell lines. Approximately 1‐Mb homozygously deleted region in the five cell lines as determined by STS markers is indicated as a horizontal red closed arrow. Genes located around this region, which are homozygously deleted (seven genes) or retained (one gene) in these five cell lines, are indicated as red or black arrows, respectively, that show positions and directions of transcription.
Figure 2
Figure 2
(a) Genomic polymerase chain reaction (PCR) analyses of genes located around the 4q35 homozygously deleted region in 39 oral squamous‐cell carcinoma (OSCC) cell lines. Homozygous deletions of TRL3, DKFZP564J, CYP4V2, KLKB1, F11, melatonin receptor 1 A (MTNR1A) and FAT were detected in two or three OSCC lines. RT7, an immortalized cell line derived from normal oral epithelial cells; LCL, normal lymphoblastoid cell line. (b) Messenger RNA (mRNA) expression of TRL3, DKFZP564J, CYP4V2, KLKB1, F11, MTNR1A and FAT in OSCC cell lines, the RT7 cell line, and primary cultured normal oral mucosa detected by reverse transcription–polymerase chain reaction (RT‐PCR). Notably, 33 of the 37 OSCC cell lines (89%) without a homozygous deletion of MTNR1A showed decreased expression of this gene, whereas RT7, an immortalized normal oral epithelial cell line, and primary cultured normal oral mucosa (primary culture) expressed the MTNR1A mRNA. (c) Representative results of RT‐PCR to reveal restored MTNR1A expression after demethylation in OSCC cell lines lacking its expression. mRNA was isolated after 5 days treatment with various concentrations of 5‐aza‐dCyd for 5 days and/or 100 ng/mL TSA for the last 12 h. GAPDH was used as an internal control.
Figure 3
Figure 3
(a) Schematic map of the CpG (cytosine and guanine separated by phosphate) island (horizontal gray thick bar) around exon 1 (open box) of melatonin receptor 1 A (MTNR1A) and representative results of bisulfite sequencing. CpG sites are indicated by vertical ticks on the expanded axis. The transcription start site is marked at +1. The fragments examined in a promoter assay are indicated by black thick lines. The regions examined in the combined bisulfite restriction analysis (COBRA) and bisulfite sequencing are indicated by black closed arrows. For the COBRA, restriction sites for BstUI and TaqI are indicated by black downward arrowheads. Representative results of bisulfite sequencing of the MTNR1A CpG island were examined in MTNR1A‐expressing oral squamous‐cell carcinoma (OSCC) cell line (+) and MTNR1A‐nonexpressing OSCC lines (–). Each square indicates a CpG site: open squares, unmethylated; solid squares, methylated. Polymerase chain reaction (PCR) primers for methylation‐specific PCR (MSP) and unmethylation‐specific PCR (USP) are indicated by arrows. (b) Representative results of the COBRA of the MTNR1A CpG island in OSCC cell lines and RT7 after restriction with BstUI for Regions 1 and 3 and TaqI for Region 2. Arrows show fragments specifically restricted at sites recognized as methylated CpG, whereas arrowheads show undigested fragments indicating unmethylated CpG. (c) Promoter activity of the MTNR1A CpG island. pGL3 basic empty vectors (mock) and constructs containing one of three different sequences around the highly methylated region of MTNR1A (Fragments 1–4; 118 bp, 190 bp, 257 bp and 565 bp in size, respectively, in Fig. 3a) were transfected into NA and OM2 cells. Luciferase activity was normalized versus an internal control. The data presented are the means ± SD for three separate experiments, each performed in triplicate.
Figure 4
Figure 4
Methylation status of the CpG (cytosine and guanine separated by phosphate) island and expression levels of melatonin receptor 1 A (MTNR1A) in primary tumors of oral squamous‐cell carcinoma (OSCC). (a) Representative results of a methylation‐specific polymerase chain reaction (MSP) analysis of the MTNR1A promoter region in primary OSCC tissues. Parallel amplification reactions were done using primers specific for methylated (M) and unmethylated (U) sequences by MSP. NA and HSC‐5 cell lines were used for predominantly methylated and unmethylated controls, respectively. (b) Results of bisulfite sequencing of the MTNR1A CpG island representative cases analyzed by MSP in primary OSCC tumors. See legend for Fig. 3 A for interpretation. Polymerase chain reaction (PCR) primers for methylation specific PCR (MSP and unmethylation‐specific PCR [USP]) are indicated by arrows. (c) Representative results of immunohistochemical staining of MTNR1A protein. Tumors in two cases showed positive MTNR1A staining in ≥10% of cancer cells (positive, +), whereas two cases showed positive MTNR1A staining in <10% of cancer cells (negative, –). In neighboring non‐neoplastic mucosa, positive immunoreactivity of MTNR1A was detected. MTNR1A immunoreactivity was present mainly in the cytoplasm and/or plasma membrane of normal epithelial cells and also of immunopositive malignant cells. Magnifications are ×200. (d) Kaplan–Meier curve for overall survival rates of 50 patients with primary OSCC tumors. Patients with negative MTNR1A expression in tumors showed significantly worse prognosis compared with those with positive expression (P = 0.0208).
Figure 5
Figure 5
Effects of restoration of melatonin receptor 1 A (MTNR1A) expression on growth of oral squamous‐cell carcinoma (OSCC) cells. (a) A FLAG‐ and Myc‐tagged construct containing MTNR1A (pCMV‐3Tag4A‐FLAG‐MTNR1A) or empty vector (pCMV‐3Tag4A‐mock) as a control was transfected into HSC‐7 or NA cells, which lack expression of the MTNR1A gene. Western‐blotting using 10 µg of membrane protein extracts prepared from cells 24 h after transfection and anti‐Myc tag antibody demonstrated that transiently pCMV‐3Tag4A‐FLAG‐MTNR1A‐transfected cells expressed epitope‐tagged MTNR1A protein. (b) Two weeks after transfection and subsequent selection of drug‐resistant colonies in 6‐well plates, the colonies formed by MTNR1A‐transfected cells were less numerous than those formed by mock‐transfected cells (left). In quantitative analysis of colony formation (right), colonies larger than 2 mm were counted, and results are presented as the means ± SD (bars) of three separate experiments, each performed in triplicate. Statistical analysis used the Mann–Whitney U‐test: *P < 0.05 versus empty‐vector transfected cells.

References

    1. Parkin DM, Bray F, Ferlay J, Pisani P. Global cancer statistics, 2002. CA Cancer J Clin 2005; 55: 74–108. - PubMed
    1. Nomura K, Sobue T, Nakatani H et al . Number of deaths and proportional mortality rates from malignant neoplasms by site in Japan (2003). In: Editorial Board of Cancer Statistics in Japan , eds. Cancer Statistics in Japan 2005. Tokyo: National Cancer Center, 2005; 36–9.
    1. Lippman SM, Hong WK. Molecular markers of the risk of oral cancer. N Engl J Med 2001; 344: 1323–6. - PubMed
    1. Scully C, Field JK, Tanzawa H. Genetic aberrations in oral or head and neck squamous cell carcinoma (SCCHN): 1. Carcinogen metabolism, DNA repair and cell cycle control. Oral Oncol 2000; 36: 256–63. - PubMed
    1. Jones PA, Baylin SB. The fundamental role of epigenetic events in cancer. Nat Rev Genet 2002; 3: 415–28. - PubMed

Publication types

Substances