. 2008 May 1:8:130.
doi: 10.1186/1471-2148-8-130.

The complete plastid genome sequence of Welwitschia mirabilis: an unusually compact plastome with accelerated divergence rates

Affiliations

The complete plastid genome sequence of Welwitschia mirabilis: an unusually compact plastome with accelerated divergence rates

Skip R McCoy et al. BMC Evol Biol. .

Abstract

Background: Welwitschia mirabilis is the only extant member of the family Welwitschiaceae, one of three lineages of gnetophytes, an enigmatic group of gymnosperms variously allied with flowering plants or conifers. Limited sequence data and rapid divergence rates have precluded consensus on the evolutionary placement of gnetophytes based on molecular characters. Here we report on the first complete gnetophyte chloroplast genome sequence, from Welwitschia mirabilis, as well as analyses on divergence rates of protein-coding genes, comparisons of gene content and order, and phylogenetic implications.

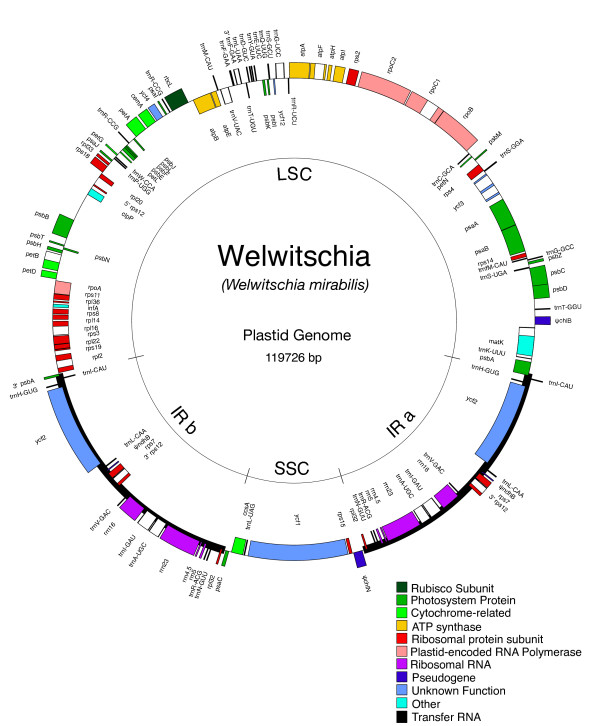
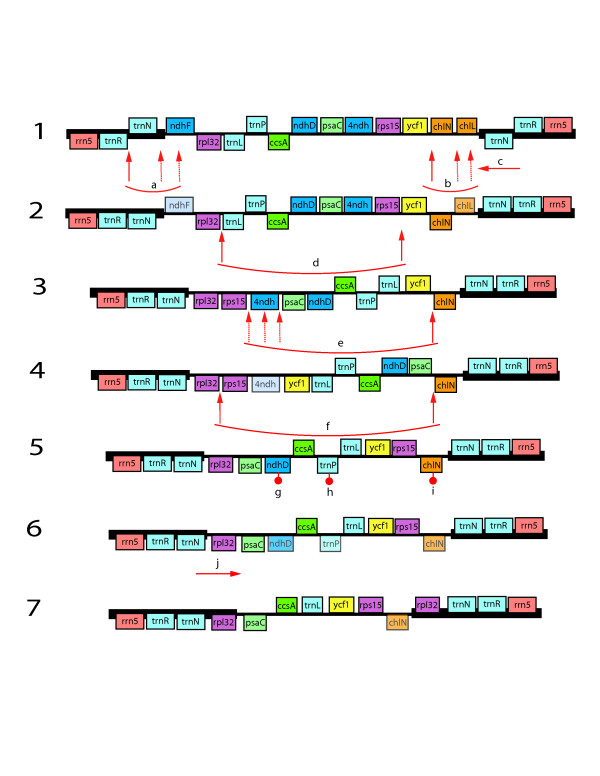
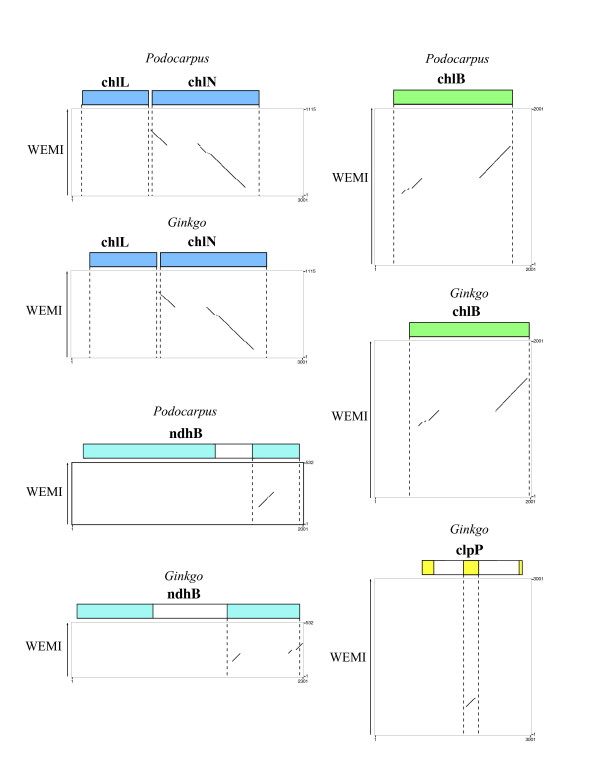
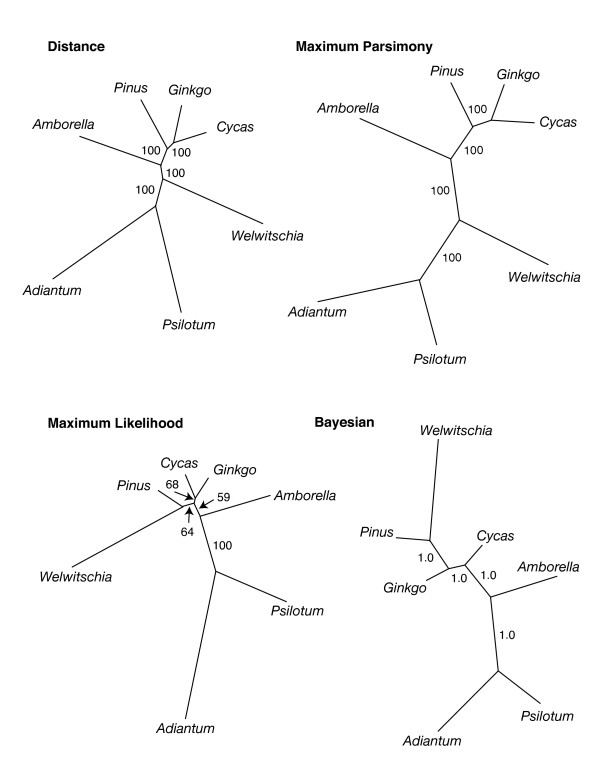
Results: The chloroplast genome of Welwitschia mirabilis [GenBank: EU342371] is comprised of 119,726 base pairs and exhibits large and small single copy regions and two copies of the large inverted repeat (IR). Only 101 unique gene species are encoded. The Welwitschia plastome is the most compact photosynthetic land plant plastome sequenced to date; 66% of the sequence codes for product. The genome also exhibits a slightly expanded IR, a minimum of 9 inversions that modify gene order, and 19 genes that are lost or present as pseudogenes. Phylogenetic analyses, including one representative of each extant seed plant lineage and based on 57 concatenated protein-coding sequences, place Welwitschia at the base of all seed plants (distance, maximum parsimony) or as the sister to Pinus (the only conifer representative) in a monophyletic gymnosperm clade (maximum likelihood, bayesian). Relative rate tests on these gene sequences show the Welwitschia sequences to be evolving at faster rates than other seed plants. For these genes individually, a comparison of average pairwise distances indicates that relative divergence in Welwitschia ranges from amounts about equal to other seed plants to amounts almost three times greater than the average for non-gnetophyte seed plants.

Conclusion: Although the basic organization of the Welwitschia plastome is typical, its compactness, gene content and high nucleotide divergence rates are atypical. The current lack of additional conifer plastome sequences precludes any discrimination between the gnetifer and gnepine hypotheses of seed plant relationships. However, both phylogenetic analyses and shared genome features identified here are consistent with either of the hypotheses that link gnetophytes with conifers, but are inconsistent with the anthophyte hypothesis.


Figures

Figure 1
Figure 1
Gene map of the Welwitschia mirabilis plastome. Genes shown on the inside of the circle are transcribed counterclockwise and those on the outside clockwise. Gene boxes are color coded by functional group as shown in the key in the figure. The genome shows a structure typical to most chloroplast genomes: two copies of the inverted repeat region separating the large and small single copy regions. There are, however, multiple gene-order changes and gene losses relative to the ancestral genome organization, as well as slight expansions of the IR at the LSC and SSC boundaries.
Figure 2
Figure 2
Rearrangement scenario showing one possible explanation of differences observed in the Welwitschia SSC region. Gene order and orientation are represented in the diagram, but genes and IGS are not shown to scale. Map 1 shows the SSC and flanking ends of the IR as the region appears in Cycas or Ginkgo, maps 2–6 are hypothetical, and map 7 illustrates the region as it appears in the Welwitschia genome. Event a is an inversion that reverses the orientation of trnN. One endpoint of this inversion may have disrupted ndhF, leading to its loss. Event b is an inversion that reverses chlN. One endpoint may have disrupted chlL. Event c is the copy correction of the second IR copy to reflect the gene order change (event a) in the other copy. Events d, e, and f are inversions modifying the order and orientation of blocks of genes within the SSC. Again, in step e, inversion breakpoints may have disrupted genes. Events g, h, and i are additional gene losses (chlN is still detectable as a pseudogene) not directly related to inversion breakpoints. Event j is an extension of the inverted repeat into the SSC to copy rpl32 into the IR. The positions of the inversion endpoints are defined by the gene adjacencies in Welwitschia as compared to the ancestral condition, however exactly how those endpoints are combined into inversion events is speculative. Thus the endpoints indicated for events b-f may have been combined in different ways and the events may have occurred in an alternative order than that represented in this model.
Figure 3
Figure 3
Harr plots comparing sequence from the Welwitschia plastome with homologous regions from Podocarpus and Ginkgo. The extent of genes found in each region of the Podocarpus and Ginkgo plastomes are shown at the top of each graph as colored boxes. The Welwitschia (WEMI) sequence is represented as the Y-axis. Diagonal lines indicate regions of similarity between the two sequences being compared. Most portions of these genes found in Podocarpus and Ginkgo lack equivalent sequence in Welwitschia and the sections exhibiting similarity are disjointed.
Figure 4
Figure 4
Phylogenetic hypotheses obtained using different optimization criteria based on 57 protein-coding plastid genes. Values associated with branches indicate the level of bootstrap support or, for the Bayesian analysis, posterior probability. Branch lengths are shown proportional to inferred amount of change in all trees.

References

    1. Gifford EM, Foster AS. Morphology and evolution of vascular plants. 3. New York: W.H. Freeman and Company; 1989.
    1. Chamberlain CJ. Gymnosperms: Structure and Function. Chicago: University of Chicago Press; 1935.
    1. Dilcher DL, Bernardes-De-Oliveira ME, Pons D, Lott TA. Welwitschiaceae from the Lower Cretaceous of Northeastern Brazil. Am J Bot. 2005;92:1294–1310. doi: 10.3732/ajb.92.8.1294. - DOI - PubMed
    1. Magallon S, Sanderson MJ. Relationships among seed plants inferred from highly conserved genes: Sorting conflicting phylogenetic signals among ancient lineages. Am J Bot. 2002;89:1991–2006. doi: 10.3732/ajb.89.12.1991. - DOI - PubMed
    1. Burleigh JG, Mathews S. Phylogenetic signal in nucleotide data from seed plants: Implications for resolving the seed plant tree of life. Am J Bot. 2004;91:1599–1613. doi: 10.3732/ajb.91.10.1599. - DOI - PubMed

Publication types

LinkOut - more resources