Review
. 2008 Jun 18;582(14):2075-85.
doi: 10.1016/j.febslet.2008.04.035. Epub 2008 Apr 29.

Directional sensing during chemotaxis

Affiliations
Review

Directional sensing during chemotaxis

Christopher Janetopoulos et al. FEBS Lett. .

Abstract

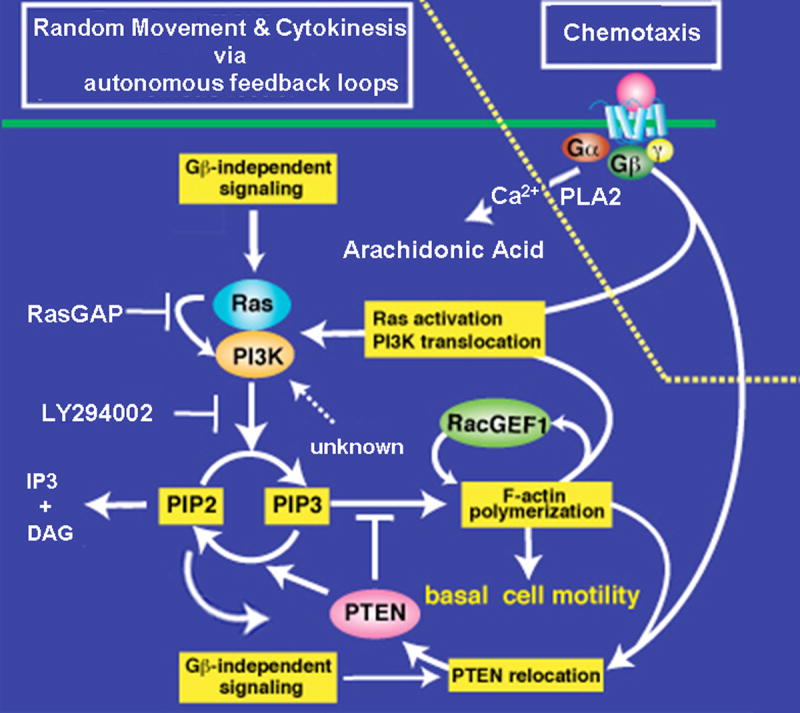
Cells have the innate ability to sense and move towards a variety of chemoattractants. We investigate the pathways by which cells sense and respond to chemoattractant gradients. We focus on the model system Dictyostelium and compare our understanding of chemotaxis in this system with recent advances made using neutrophils and other mammalian cell types, which share many molecular components and signaling pathways with Dictyostelium. This review also examines models that have been proposed to explain how cells are able to respond to small differences in ligand concentrations between the anterior leading edge and posterior of the cell. In addition, we highlight the overlapping functions of many signaling components in diverse processes beyond chemotaxis, including random cell motility and cell division.


Figures

Figure 1
Figure 1. Chemotaxis of Dictyostelium cells
The DIC image shows Dictyostelium cells chemotaxing towards a micropipette emitting the chemoattractant cAMP.
Figure 2
Figure 2. Directional sensing occurs downstream of G-protein activation and upstream of PI(3,4,5)P3 accumulation
Upper panels show the spatial co-localization of PI(3,4,5)P3 (PI3K activity) and activated Ras (Ras-GTP) to the leading edge of a chemotaxing Dictyostelium cell coexpressing the reporters RFP-PHAtk and GFP-Ras binding domain (RBDRaf1), respectively. The central panels show schematic depictions of the distribution of components or reactions at different steps in the chemotactic signaling pathway. With the exception of receptor occupancy and G-protein activation, all of the distributions were determined by imaging GFP fusion proteins in chemotaxing cells. The distribution of F-actin was inferred from imaging of the actin binding proteins LimEΔcoil and coronin and was confirmed by phalloidin staining in fixed cells. Receptor occupancy was visualized by single molecule imaging of Cy3-cAMP. G-protein activation is inferred by a fluorescence resonance energy transfer assay that measures dissociation of the α- and β-subunits of the G-protein. The lower panels depict the activation kinetics of the components described above in response to a uniform (global) stimulation by chemoattractant (cAMP). All of the responses except heterotrimeric G protein activation are transient. For Ras, peak activation occurs ∼3-5 sec after stimulation, while PI3K activity peaks at ∼5-7 sec. The figure illustrates that heterotrimeric G protein activation rapidly ceases upon removal of the chemoattractant. This figure is reproduced from Sasaki et al [112].
Figure 3
Figure 3. Local excitation, global inhibition model for temporal and spatial sensing
Receptor occupancy regulates two opposing processes, excitation and inhibition, which together regulate the response (green, red, and black lines, respectively). When a cell is initially exposed to a gradient, both ends respond. The fast local excitation processes increase proportionally to the local fraction of occupied receptors. The slow inhibitory response rises, driven by the global fraction of occupied receptors. When both processes reach a steady state (lower panel), the profile of excitation along the length of the cell is proportional to the local fraction, whereas the global inhibitor is proportional to the mean level of receptor occupancy, respectively. Thus, at the front, excitation exceeds inhibition, leading to a persistent response and vice versa at the rear.
Figure 4
Figure 4. Response of cells to combinations of stimuli
Latrunculin-treated cells were exposed to sequential temporal and spatial stimuli, and images were captured. (A) A micropipette (location denoted by the asterisk) producing a stable cAMP gradient was introduced to naïve cells after the first frame (0 sec). (B) Cells originally in a gradient (0 sec) were further stimulated by a transient bolus of cAMP generated by pumping the micropipette. Fluorescent images of the Cy3-cAMP used in these experiments demonstrated that the stimulus from the initial bolus dissipated in the 4-ml chamber, and the stable gradient was re-established within 15 sec. (C) Cells were exposed to competing gradients of cAMP and their PH-GFP responses were acquired. PH-GFP responses could be elicited or extinguished by gradually lowering or raising the micropipette pressures. Asterisks mark the locations of micropipettes.
Figure 5
Figure 5. Model for the Ras/PI3K circuit during random movement and chemotaxis
We propose that Ras/PI3K/PTEN/F-actin components form a feedback loop that is activated autonomously and without extracellular stimuli. The feedback loop we describe requires cytoskeletal regulators that simultaneously recruit PI3K and de-localize PTEN from the protrusion site. We assume that the regulators for Ras/PI3K/PTEN and F-actin polymerization/disassembly can influence the initiation and decay of the circuit. As the process is stochastic, we hypothesize that an increase in the level of any of the responses over a threshold level may be sufficient to trigger the feedback loops and pseudopod formation, while components such as GAPs and phosphatases regulate the threshold and level/time of activation. The model illustrates the proposed intracellular signaling pathways leading to a positive feedback amplification of the pathways controlling pseudopod extension. PI3K, which is translocated to the membrane and activated by Ras-GTP together with PTEN released from the membrane and possibly other regulators, induces PI(3,4,5)P3 synthesis, which elicits F-actin polymerization. PLC activation leads to a loss of PI(4,5)P2, and thus may limit the number of binding sites for PTEN, which contains a putative PI(4,5)P2-binding motif. PI3K and RacGEF1 are recruited to the F-actin polymerization site, by a mechanism that is dependent on F-actin and possibly other cellular factors, and induce further PI(3,4,5)P3 synthesis and Rac activation, respectively. F-actin polymerization and PI(3,4,5)P3 signaling provoke additional Ras activation, possibly through the recruitment of RasGEFs. Each of these enzymatic processes is modulated by negative regulators of the cytoskeleton and signaling modules, such as RasGAPs, RacGAPs, PTEN, and PLC. Those negative regulators, or inhibitory events, determine the turnover and threshold for autonomous activation of the Ras/PI3K/F-actin feedback loop. Chemoattractants induce Ras/PI3K activation and reciprocal PI3K and PTEN localization through heterotrimeric G-proteins (right), as well as the activation of PLC. We expect that there are additional upstream regulators and factors that mediate PI3K's cortical localization, which is dependent on F-actin-polymerization (sensitive to Lattrunculin A/B). Activation of Ras/PI3K and inhibition of PTEN are integrated into a similar positive feedback loop that amplifies the initial response and is required for pseudopod formation and the formation of a robust, stable leading edge [30]. Chemotaxing wild-type cells and mutant strains such as pi3k1/2 null cells have a higher threshold for the autonomous Ras/PI3K/F-actin activation than unstimulated (“naïve”) vegetative cells. In chemotaxing cells, the threshold is higher at the back than at the front because PTEN, and possibly other negative regulators, localize at the back, as is graphically illustrated. PTEN activity and synthesis of PI(4,5)P2 likely forms a positive feedback loop with its own recruitment to the plasma membrane. Ligand-induced Ras/PI3K activation at the front, but not at the back, reaches a threshold level, which activates downstream responses. In polarized, chemotaxing cells, the threshold for pathway activation is significantly higher at the back than at the front. This differential threshold depends on both the stabilization of signaling complexes at the existing leading edge by the F-actin cytoskeleton and the localization of negative regulators at the cell's posterior.

Similar articles

Cited by

References

    1. Rubel EW, Cramer KS. Choosing axonal real estate: location, location, location. J Comp Neurol. 2002;448:1–5. - PubMed
    1. Martin P, Parkhurst SM. Parallels between tissue repair and embryo morphogenesis. Development. 2004;131:3021–34. - PubMed
    1. Moser B, Loetscher P. Lymphocyte traffic control by chemokines. Nat Immunol. 2001;2:123–8. - PubMed
    1. Thelen M. Dancing to the tune of chemokines. Nat Immunol. 2001;2:129–34. - PubMed
    1. Le Y, Zhou Y, Iribarren P, Wang J. Chemokines and chemokine receptors: their manifold roles in homeostasis and disease. Cell Mol Immunol. 2004;1:95–104. - PubMed

Substances