. 2008 Apr;32(4):361-6.
doi: 10.1016/j.cellbi.2008.03.002. Epub 2008 Mar 20.

Ca2+-dimethylphosphate complex formation: providing insight into Ca2+-mediated local dehydration and membrane fusion in cells

Affiliations

Ca2+-dimethylphosphate complex formation: providing insight into Ca2+-mediated local dehydration and membrane fusion in cells

Jeffrey J Potoff et al. Cell Biol Int. 2008 Apr.

Abstract

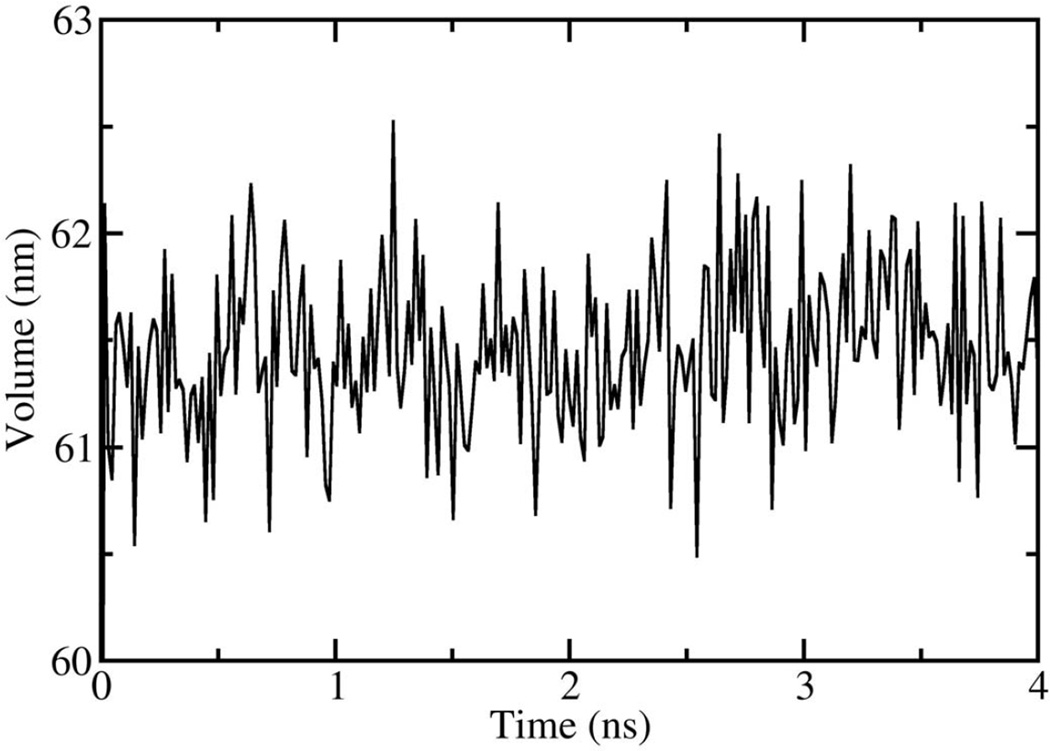
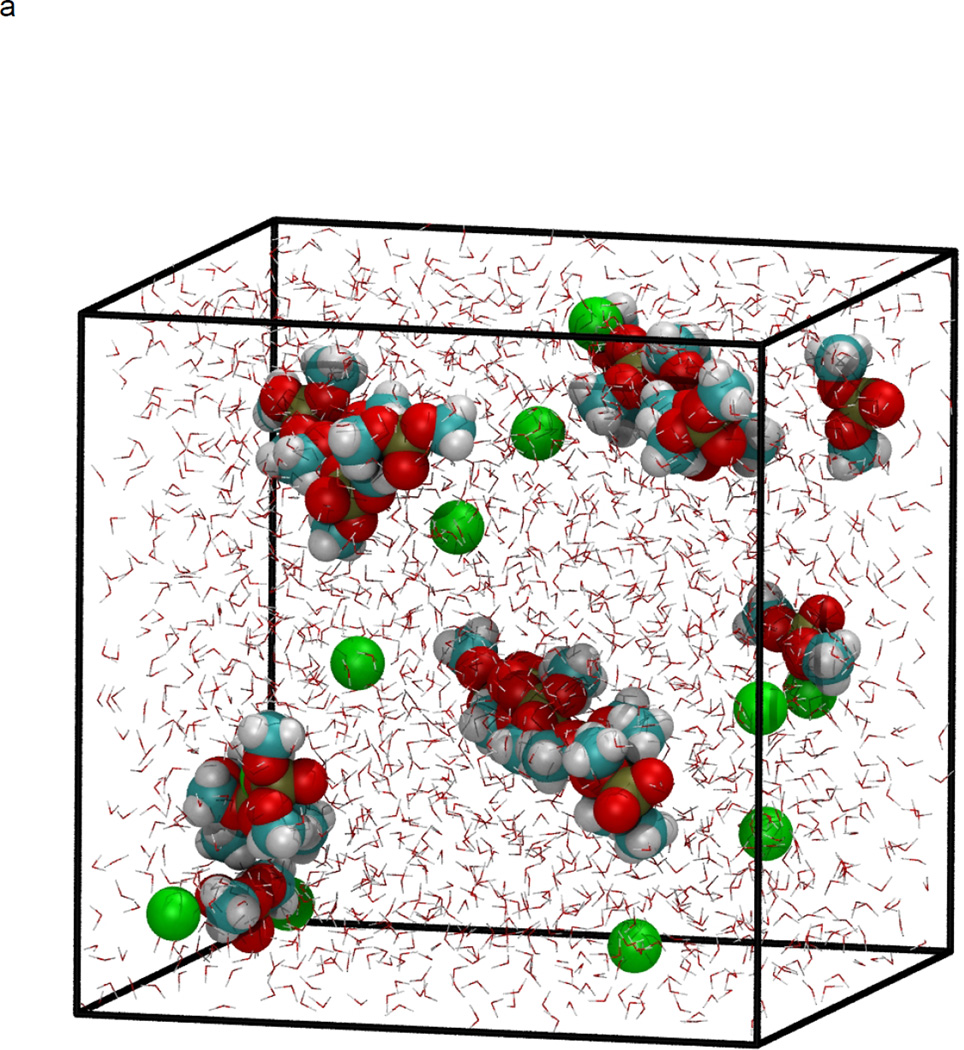
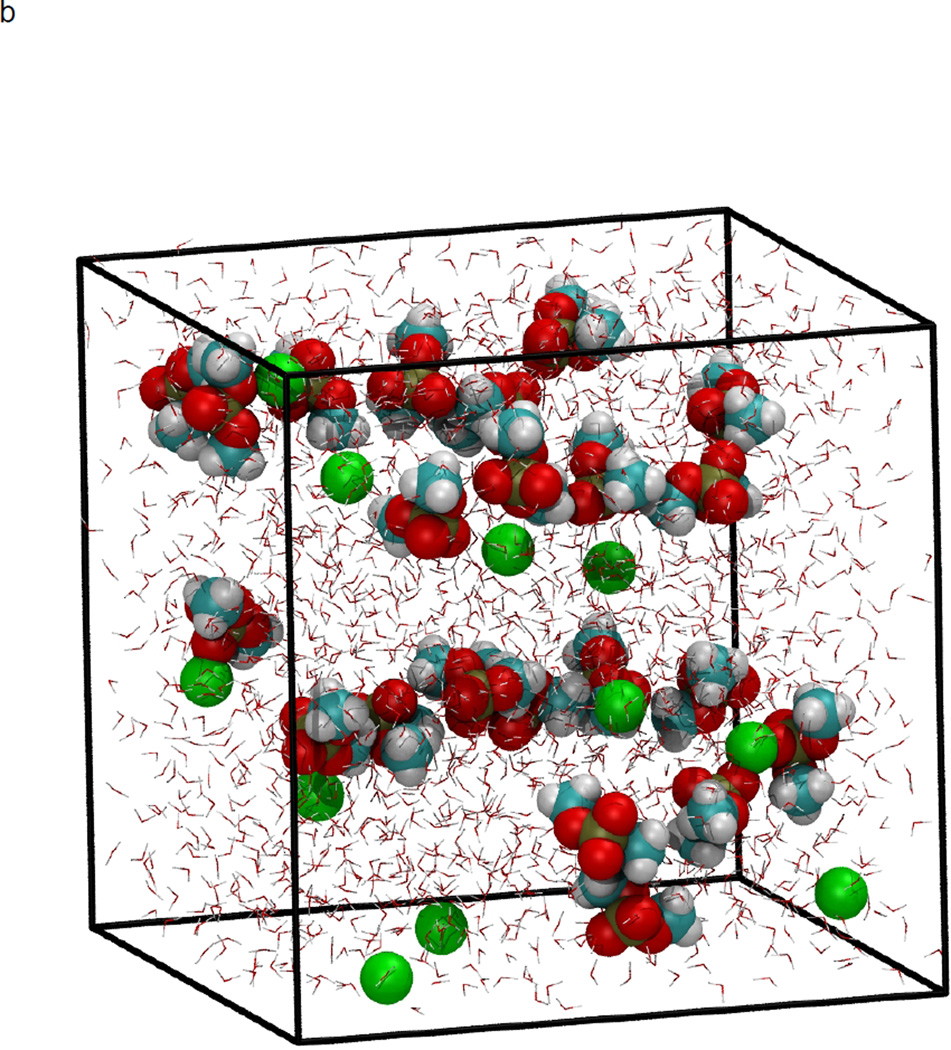
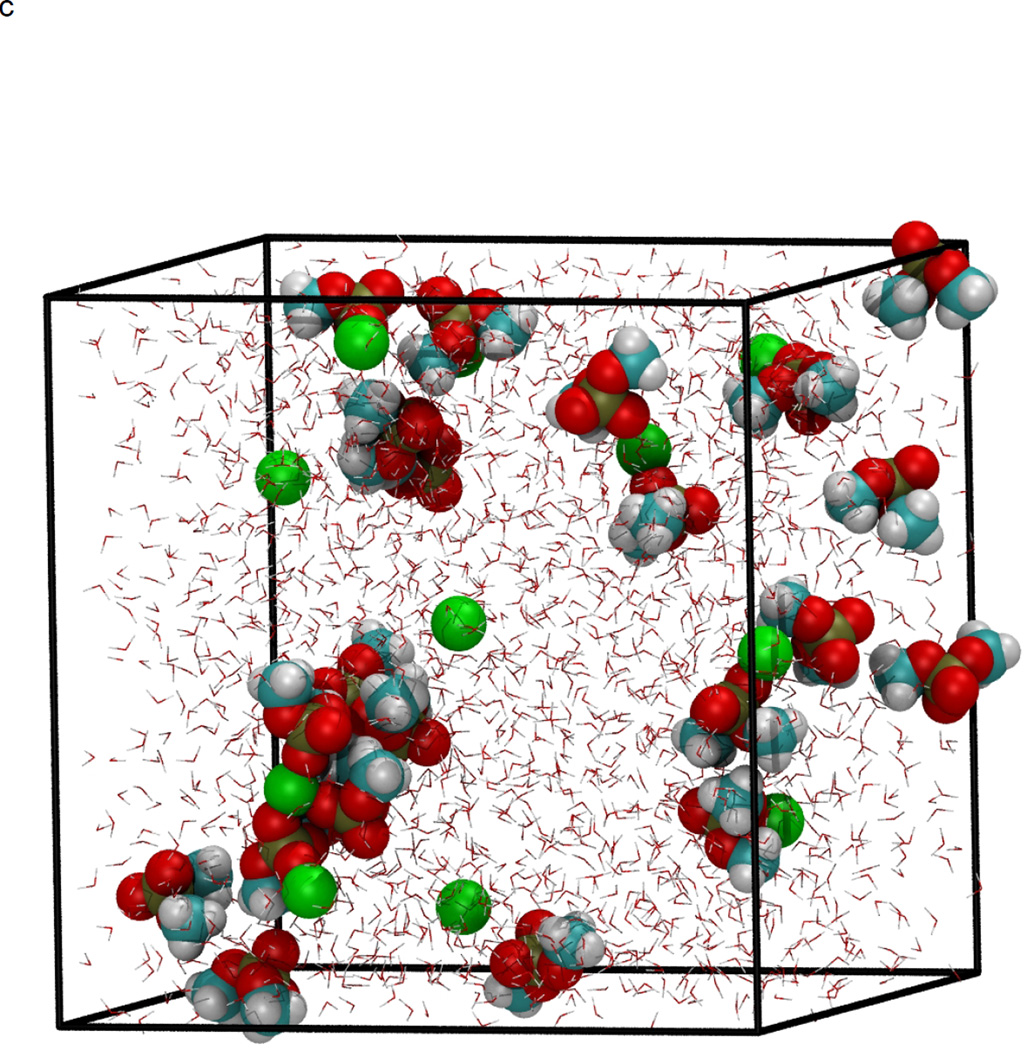
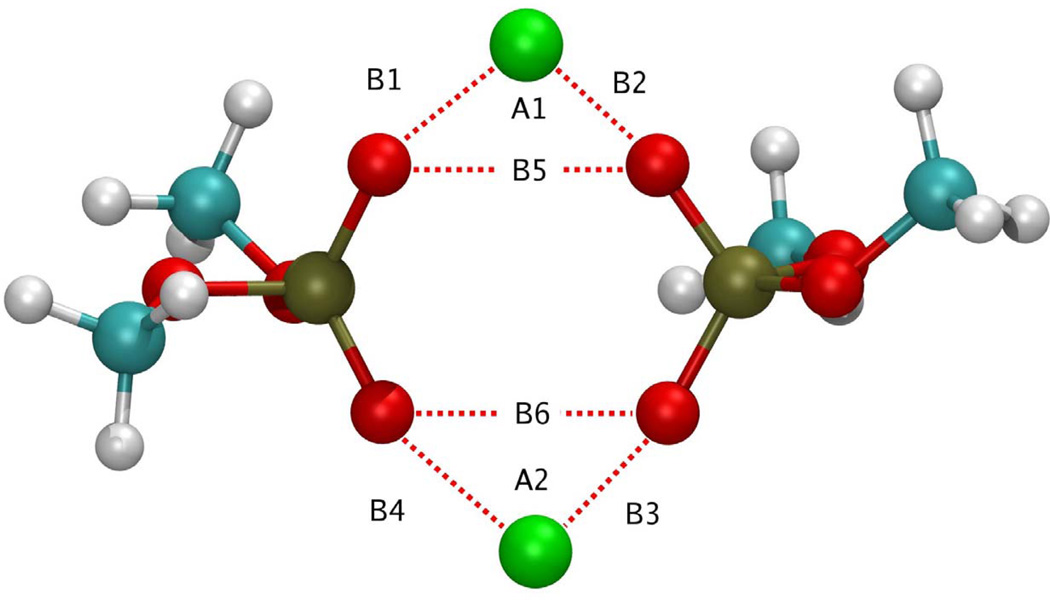
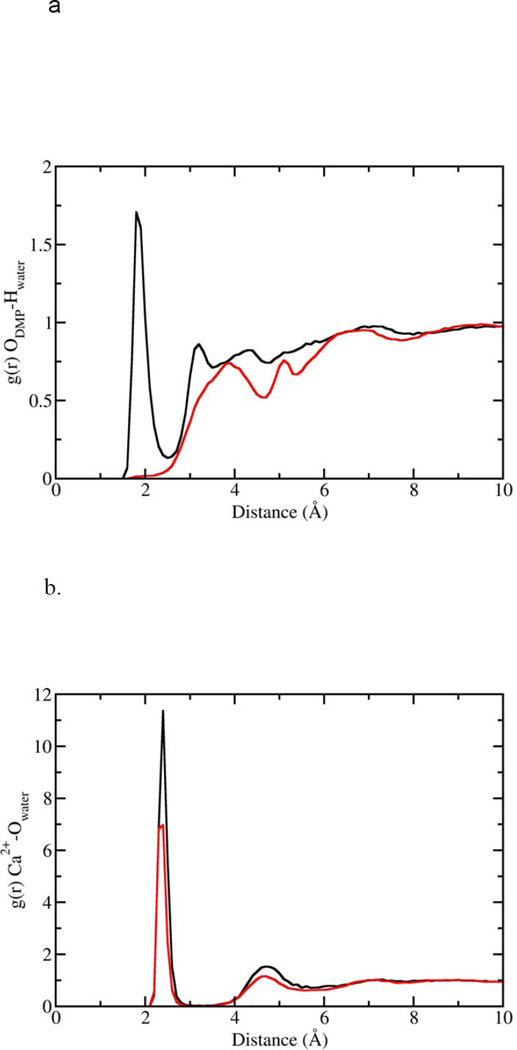
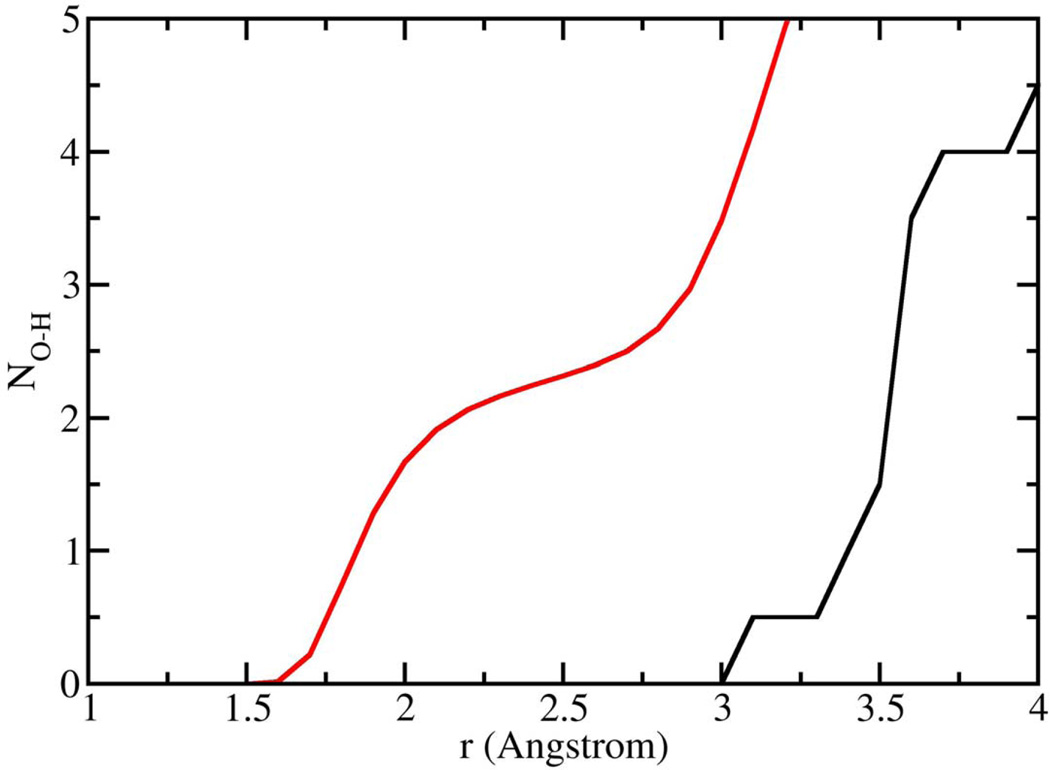
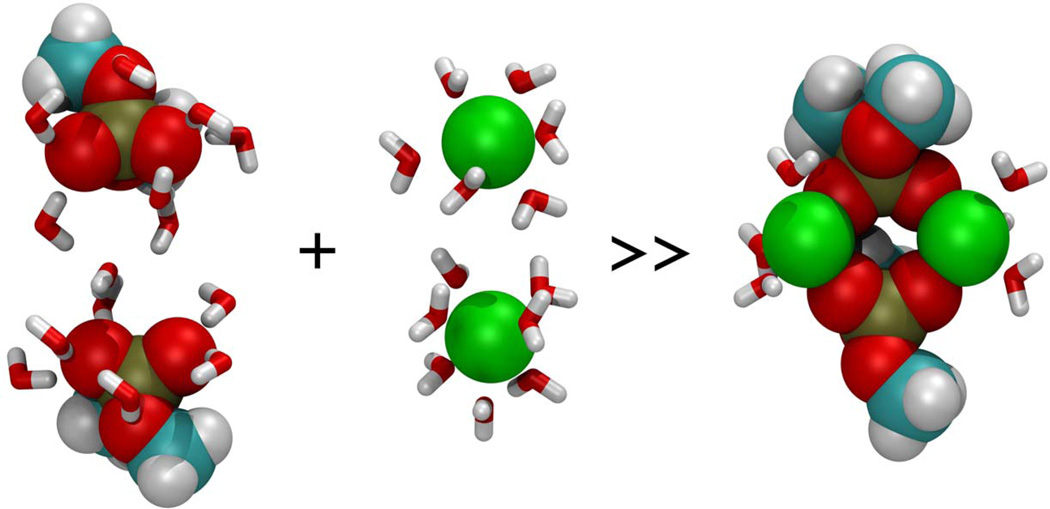
Earlier studies using X-ray diffraction, light scattering, photon correlation spectroscopy, and atomic force microscopy, strongly suggest that SNARE-induced membrane fusion in cells proceeds as a result of calcium bridging opposing bilayers. The bridging of phospholipid heads groups in the opposing bilayers by calcium leads to the release of water from hydrated Ca(2+) ions as well as the loosely coordinated water at PO-lipid head groups. Local dehydration of phospholipid head groups and the calcium, bridging opposing bilayers, then leads to destabilization of the lipid bilayers and membrane fusion. This hypothesis was tested in the current study by atomistic molecular dynamic simulations in the isobaric-isothermal ensemble using hydrated dimethylphosphate anions (DMP(-)) and calcium cations. Results from the study demonstrate, formation of DMP-Ca(2+) complexes and the consequent removal of water, supporting the hypothesis. Our study further demonstrates that as a result of Ca(2+)-DMP self-assembly, the distance between anionic oxygens between the two DMP molecules is reduced to 2.92A, which is in close agreement with the 2.8A SNARE-induced apposition established between opposing bilayers, reported earlier from X-ray diffraction measurements.


Figures

Figure 1
Figure 1
Volume as a function of time, for NPT molecular dynamics simulations at 298 K and 101.3 kPa.
Figure 2
Figure 2
NPT molecular dynamics simulation at 298 K and 101.3 kPa, demonstrating formation of DMP-Ca2+ complex. Initial configuration at time=0 (a), and after minimization and heating (b), four ns of simulation at 298 K and 101.3 kPa (c), and 8 ns (d). Atoms are color coded as: Carbon (cyan), hydrogen (white), oxygen (red), phosphorous (gold), and Ca2+ (green). Water molecules are represented as background red-white V’s for clarity.
Figure 2
Figure 2
NPT molecular dynamics simulation at 298 K and 101.3 kPa, demonstrating formation of DMP-Ca2+ complex. Initial configuration at time=0 (a), and after minimization and heating (b), four ns of simulation at 298 K and 101.3 kPa (c), and 8 ns (d). Atoms are color coded as: Carbon (cyan), hydrogen (white), oxygen (red), phosphorous (gold), and Ca2+ (green). Water molecules are represented as background red-white V’s for clarity.
Figure 3
Figure 3
Radial distribution function for Ca2+-O(water) interactions as a function of timestep. Zero to 4 ns (black line), 4–8 ns (red line), 8–16 ns (green line), 16–20 ns (blue line).
Figure 4
Figure 4
Ca2+-DMP ring complex observed during molecular dynamics simulations. Atoms are colored as follows: Carbon (cyan), hydrogen (white), oxygen (red), phosphorous (gold), and Ca2+ (green). B1=2.146 Å, B2 = 2.145 Å, B3 = 2.140 Å, B4=2.145 Å, B5 = 2.92 Å, B6 = 2.92 Å, A1 = 85.79°, A2 = 85.07°.
Figure 5
Figure 5
Ca2+-O(DMP) interaction distances as a function of time step. Data correspond to the 16–20ns portion of the NPT molecular dynamics simulations. Distances correspond to labels in Figure S4; B1 (black line), B2 (red line), B3 (blue line), B4 (green line).
Figure 6
Figure 6
Radial distribution functions for water interacting with the DMP and Ca2+. (a) Hydrogen atoms of water interacting with anionic DMP oxygens. Black curve corresponds to DMP− in free solution; red curve corresponds to DMP− bound to Ca2+. (b) Oxygen of water interacting with Ca2+. Black curve represents Ca2+ unbound to DMP−; red curve represents Ca2+ bound to DMP.
Figure 7
Figure 7
Number integrals for the anionic oxygens of DMP interacting with the hydrogen atoms of water as determined from NPT molecular dynamics simulations at 298 K and 101.3 kPa. Red line corresponds to DMP that is not bound to Ca2+, while the black curve represents interactions of water with the same oxygens for the Ca2+-DMP ring complex.
Figure 8
Figure 8
Ca2+-DMP complex (extreme right) formed in NTP MD simulations at 298 K and 101.3 kPa. Hydrated calcium ions (center), and hydrated DPM molecules (extreme left), interact to form Ca2+-DMP complex (extreme right) having less associated water molecules. Color codes of atoms: Carbon (cyan), Hydrogen (white), Oxygen (red), Phosphorous (gold), Calcium (green), and water (red-white V’s).

Comment in

Similar articles

Cited by

References

    1. Bockmann RA, Grubmuller H. Multistep binding of divalent cations to phospholipid bilayers: a molecular dynamics study. Angew. Chem. Int. Ed. 2004;43:1021–1024. - PubMed
    1. Foloppe N, MacKerell AD., Jr An improved empirical potential energy function for molecular simulations of phospholipids. J. Comput. Chem. 2000;21:86–104.
    1. Guan Y, Wurrey CJ, Thomas GJ., Jr Vibrational analysis of nucleic acids. I. The phosphodiester group in dimethyl phosphate model compounds: (CH3O)2PO2-, (CD3O)2PO2-, and (13CH3O)2PO2- Biophys. J. 1994;66:225–235. - PMC - PubMed
    1. Guan Y, Choy GS-C, Glaser R, Thomas G., Jr Vibrational Analysis of Nucleic Acids. 2. Ab Initio Calculation of the Molecular Force Field and Normal Modes of Dimethyl Phosphate. J. Phys. Chem. 1995;99:12054–12062.
    1. Humphrey W, Dalke A, Schulten K. VMD: Visual molecular dynamics. J. Molec. Graphics. 1996;14:33–38. - PubMed

Publication types

LinkOut - more resources