

Review
doi: 10.1007/978-1-60327-148-6_6.
Clinical uses of microarrays in cancer research
Affiliations
- PMID: 18453086
- PMCID: PMC4485473
- DOI: 10.1007/978-1-60327-148-6_6
Item in Clipboard
Review
Clinical uses of microarrays in cancer research
Methods Mol Med.
2008.
Abstract
Perturbations in genes play a key role in the pathogenesis of cancer. Microarray-based technology is an ideal way in which to study the effects and interactions of multiple genes in cancer. There are many technologic challenges in running a microarray study, including annotation of genes likely to be involved, designing the appropriate experiment, and ensuring adequate quality assurance steps are implemented. Once data are normalized, they need to be analyzed; and for this, there are numerous software packages and approaches.
Figures
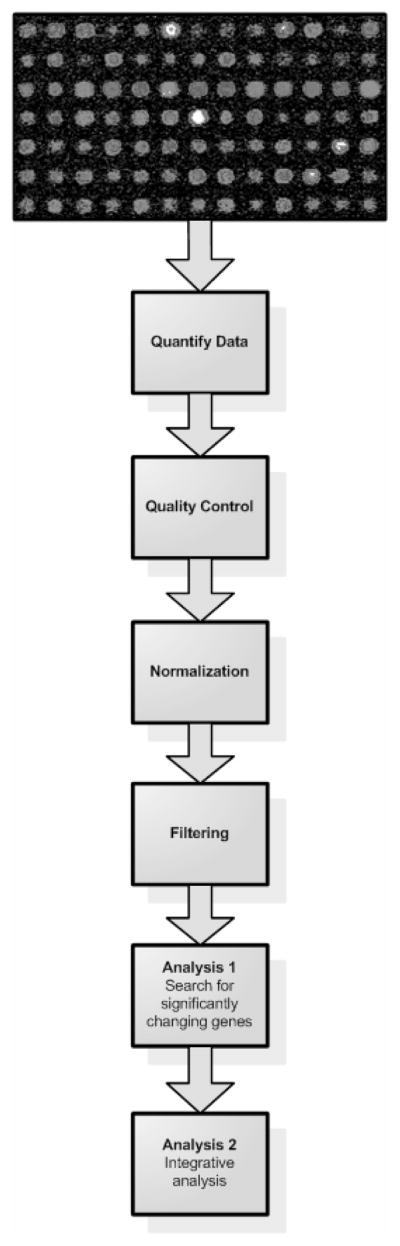
Generalized process flowchart for analyzing microarray data.
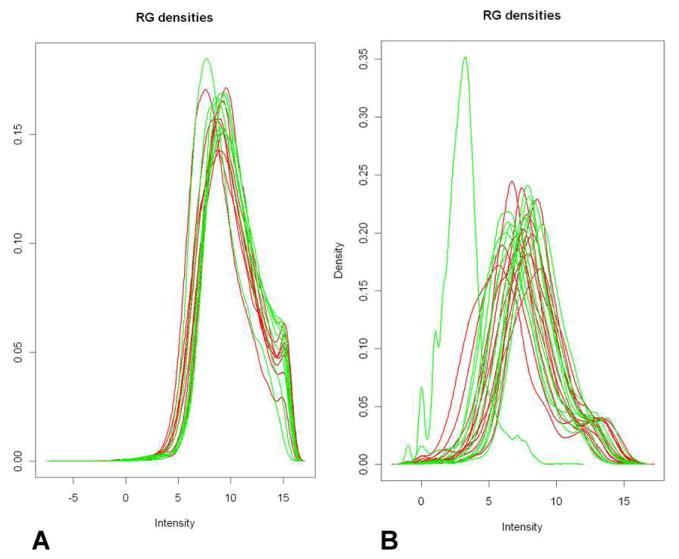
(A) A typical density histogram for a series of 20 slides. The red and green lines each indicate either the red or green channels. (B) A series of slides where there was a problem during RNA extraction and labeling.
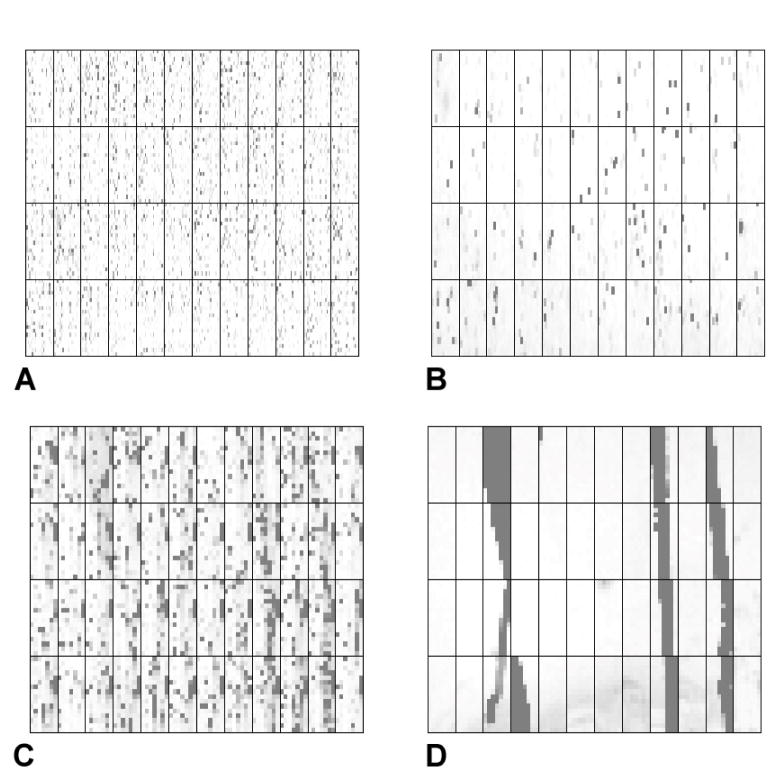
(A) Foreground and (B) background signal intensities for a slide with a suitable degree of quality. (C) Foreground and (D) background signal intensities for a slide with problem that occurred during hybridization.
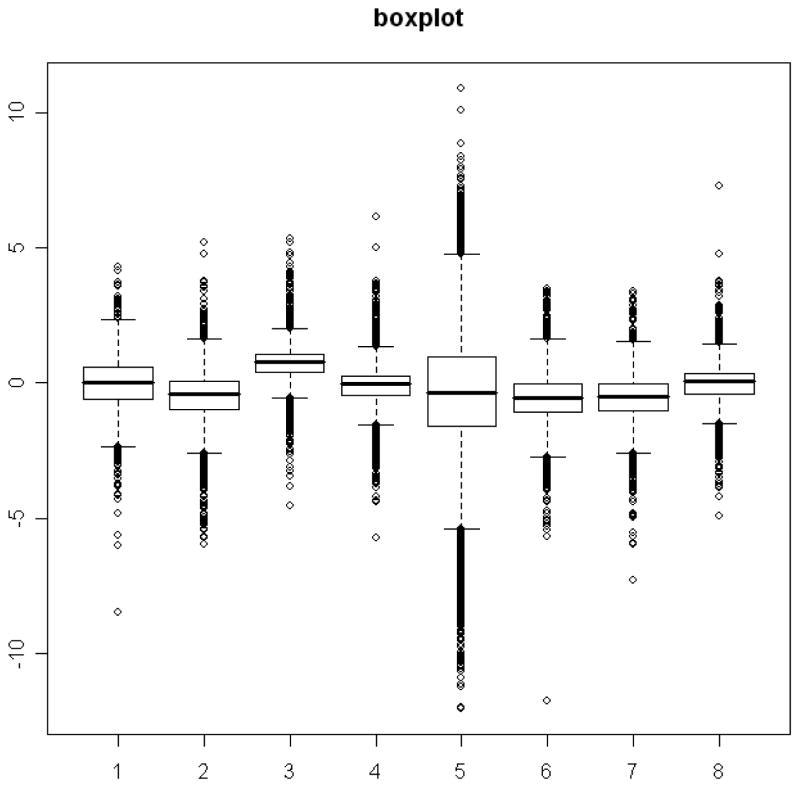
Boxplot diagram for six slides with varying degrees of scatter and quality. A boxplot displays summary statistics such as central tendency and variability for each slide.
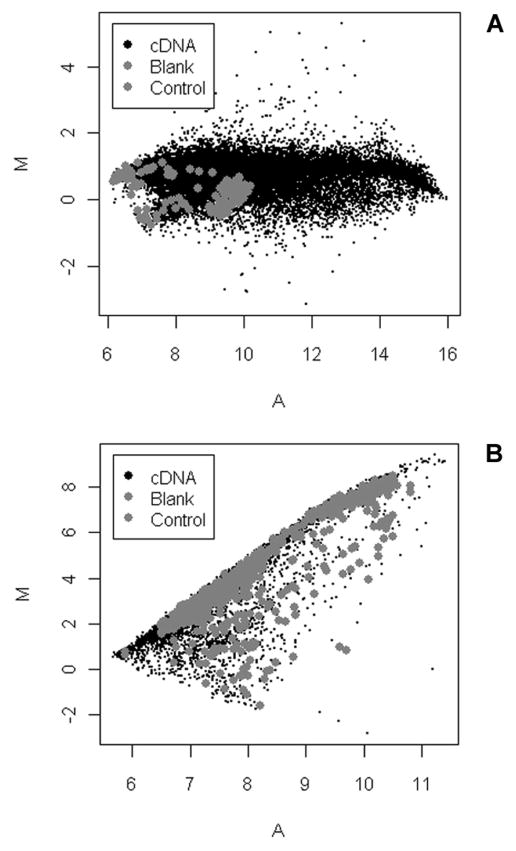
M (log intensity ratios) versus A (log total intensity) plots showing scatter from a typical slide of (A) good quality and (B) poor quality. An MA (intensity scatter) plot compares intensity on two colors (or two chips).
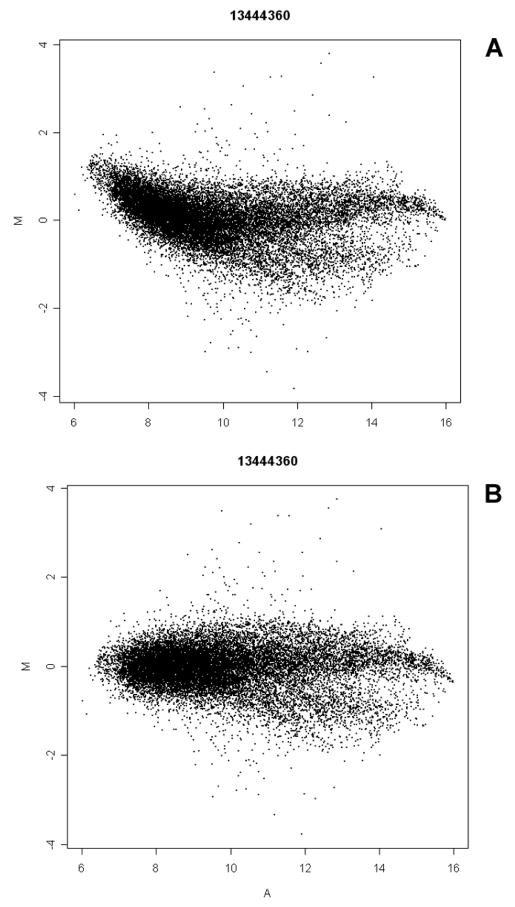
MA plot of a slide (a) before loess normalization and (b) after loess normalization.
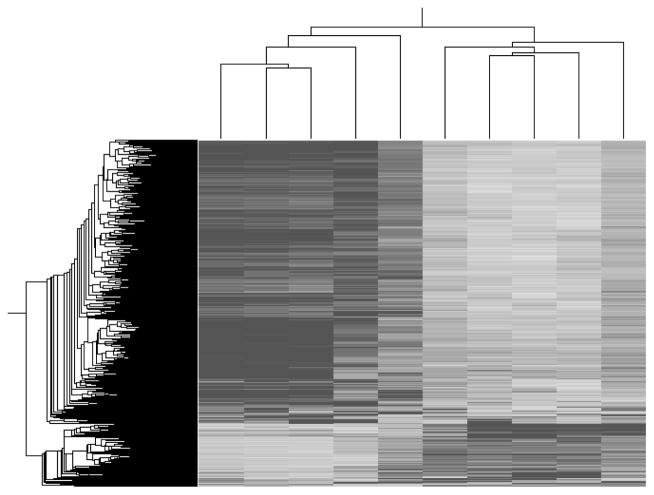
A typical dendogram obtained after performing a 2-way hierarchical clustering Branches on the left indicate genes which cluster together according to similarity of expression. Likewise, branches across the top indicate the degree of similarity of individual samples. In this case, it is evident that there are two distinct groupings of samples according to their expression across a wide number of genes.
References
-
- Balmain A. Cancer Genetics: From Boveri and Mendel to Microarrays. Nat Rev Cancer. 2001;1:77–82. - PubMed
-
- Watson JD, Crick FH. Genetical implications of the structure of deoxyribonucleic acid. Nature. 1953;171:964–967. - PubMed
-
- Stehelin D, Varmus HE, Bishop JM, Vogt PK. DNA related to the transforming gene(s) of avian sarcoma viruses is present in normal avian DNA. Nature. 1976;260:170–173. - PubMed
-
- Friend SH, Bernards R, Rogelj S, Weinberg RA, Rapaport JM, Albert DM, et al. A human DNA segment with properties of the gene that predisposes to retinoblastoma and osteosarcoma. Nature. 1986;323:643–646. - PubMed
-
- Hanahan D, Weinberg RA. The Hallmarks of Cancer. Cell. 2000;100:57–70. - PubMed
Publication types
MeSH terms
Grants and funding
LinkOut - more resources
Full Text Sources
Other Literature Sources
