. 2008 Aug;7(8):1517-29.
doi: 10.1074/mcp.M800052-MCP200. Epub 2008 May 2.

A proteomics approach for identification of single strand DNA-binding proteins involved in transcriptional regulation of mouse mu opioid receptor gene

Affiliations

A proteomics approach for identification of single strand DNA-binding proteins involved in transcriptional regulation of mouse mu opioid receptor gene

Hack Sun Choi et al. Mol Cell Proteomics. 2008 Aug.

Abstract

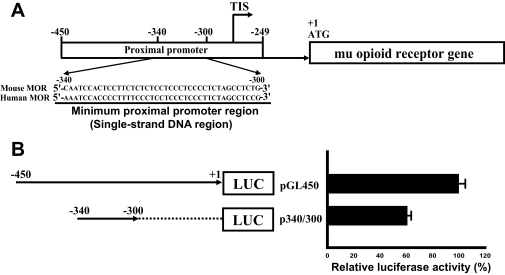
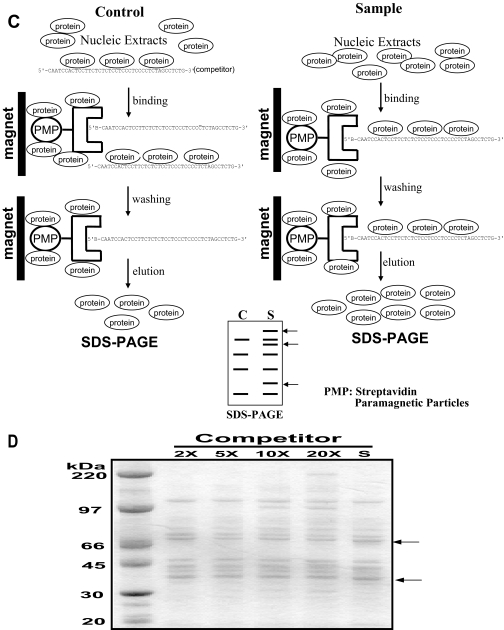
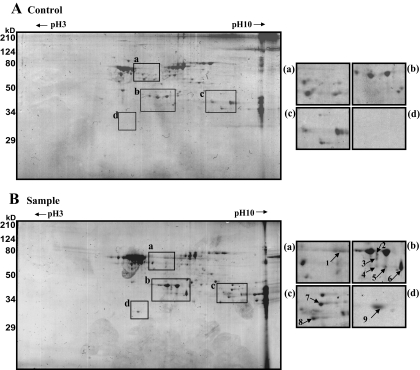
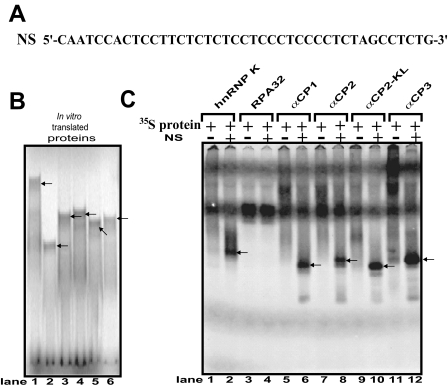
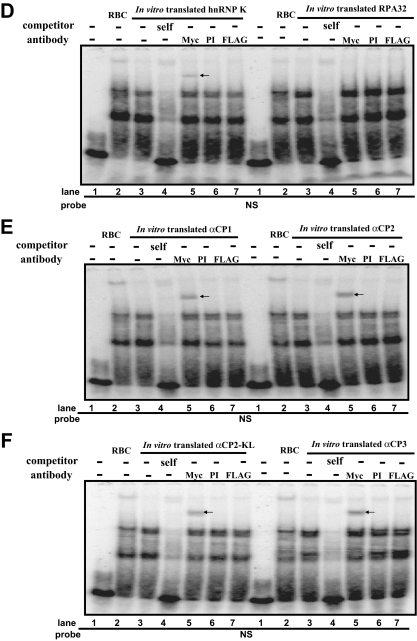
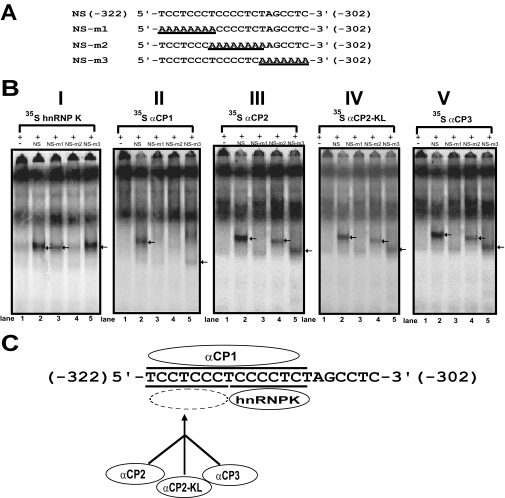
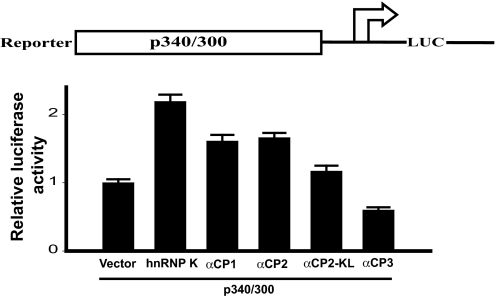
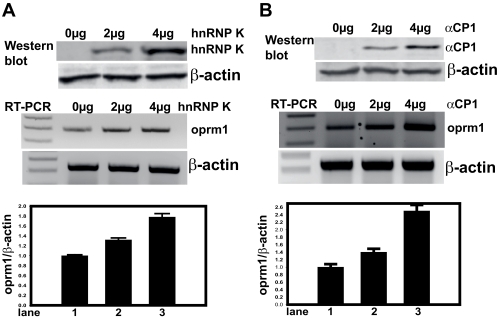
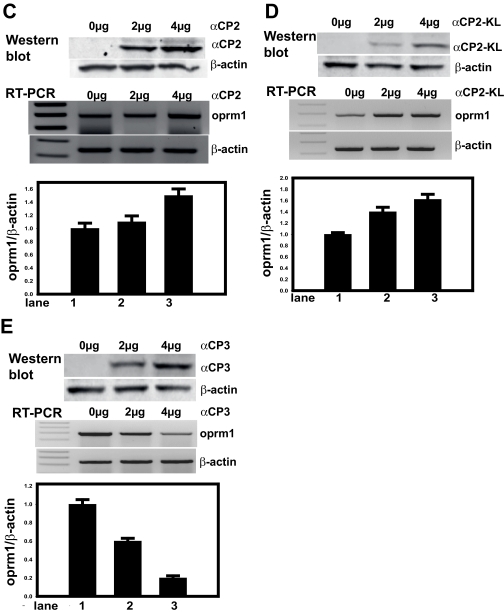
The pharmacological actions of morphine and morphine-like drugs such as heroin are mediated primarily through the mu opioid receptor. Previously a single strand DNA element of the mouse mu opioid receptor gene (Oprm1) proximal promoter was found to be important for regulating Oprm1 in neuronal cells. To identify proteins binding to the single strand DNA element as potential regulators for Oprm1, affinity column chromatography with the single strand DNA element was performed using neuroblastoma NS20Y cells followed by two-dimensional gel electrophoresis and MALDI-TOF mass spectrometry. We identified five poly(C)-binding proteins: heterogeneous nuclear ribonucleoprotein (hnRNP) K, alpha-complex proteins (alphaCP) alphaCP1, alphaCP2, alphaCP2-KL, and alphaCP3. Binding of these proteins to the single strand DNA element of Oprm1 was sequence-specific as confirmed by supershift assays. In cotransfection studies, hnRNP K, alphaCP1, alphaCP2, and alphaCP2-KL activated the Oprm1 promoter activity, whereas alphaCP3 acted as a repressor. Ectopic expression of hnRNP K, alphaCP1, alphaCP2, and alphaCP2-KL also led to activation of the endogenous Oprm1 transcripts, and alphaCP3 repressed endogenous Oprm1 transcripts. We demonstrate novel roles as transcriptional regulators in Oprm1 regulation for hnRNP K and alphaCP binding to the single strand DNA element.


Figures

F<sc>ig</sc>. 1.
Fig. 1.
Schematic representation of mouse Oprm1 and the procedure for one-step purification of single strand DNA-binding proteins using an affinity column. A, the minimum proximal promoter region (single strand DNA sequence) of mouse Oprm1 proximal promoter. TIS, transcription initiation site. B, functional analysis of the mouse Oprm1 proximal promoter (pGL450) and minimum Oprm1 proximal promoter (p340/300). C, outline of the new one-step purification of single strand DNA-binding proteins using an affinity column. Single strand oligonucleotides biotinylated on the 5′ terminus were used as affinity particles. Nuclear proteins were added to the affinity particles, incubated, and washed. Proteins bound to the particles were released by heating in SDS sample buffer. Control experiments to eliminate nonspecific binding were performed by preincubating the nuclear proteins with a 10-fold excess of nonbiotinylated single strand DNA as a competitor prior to affinity binding. D, Coomassie-stained gel of single strand DNA-binding proteins purified from NS20Y nuclear extracts with various concentrations (2×, 5×, 10×, and 20×) of competitor. S, no added competitor; C, control; PMP, paramagnetic particle; MOR, μ opioid receptor.
F<sc>ig</sc>. 2.
Fig. 2.
Coomassie-stained 2-DE images of single strand DNA-binding proteins purified using an affinity column. Purified samples were separated on pH 3–10 IPG strips followed by separation by 12% SDS-PAGE. A, control. B, sample. Molecular mass markers are indicated on the left, and pI values are indicated across the top. ad, annotated spots (19) were subjected to analysis by MALDI-TOF mass spectrometry and bioinformatics. Detailed information on each spot is listed in Table I.
F<sc>ig</sc>. 3.
Fig. 3.
EMSA of in vitro translated Myc-tagged hnRNP K, RPA32, αCP1, αCP2, αCP2-KL, and αCP3 using the anti-Myc antibody. A, the Oprm1 NS sequence. B, hnRNP K, RPA32, αCP1, αCP2, αCP2-KL, and αCP3 proteins radiolabeled in vitro with [35S]methionine (lanes 16, respectively). C, EMSAs performed with NS and the in vitro labeled proteins. Lanes 1, 3, 5, 7, 9, and 11, negative controls (i.e. no NS probe); lanes 2, 4, 6, 8, 10, and 12, [35S]methionine-labeled proteins. DF, EMSAs were performed using 32P-labeled NS as a probe with in vitro translated proteins. Lane 1, probe alone; lane 2, reticulocyte (RBC) without antibody; lane 3, no added antibody; lane 4, self-competitor without antibody; lane 5, anti-c-Myc antibody; lane 6, preimmune (PI) serum; lane 7, anti-FLAG antibody. The protein-single strand DNA complexes are indicated by arrows.
F<sc>ig</sc>. 4.
Fig. 4.
EMSA analysis of hnRNP K and αCP binding motifs using mutant oligonucleotide sequences. A, NS sequence and mutant oligonucleotide sequences (NS-m1NS-m3). B, EMSAs were performed using unlabeled NS (lane 2) or unlabeled mutant sequences (NS-m1NS-m3; lanes 35) and [35S]methionine-labeled proteins translated in vitro from the pcDNA4 expression vectors. Lane 1, negative control (no NS sequence). The protein-single strand DNA complexes are indicated by arrows. C, schematic representation of the binding motif for hnRNP K, αCP1, αCP2, αCP2-KL, and αCP3 on the single strand DNA sequence.
F<sc>ig</sc>. 5.
Fig. 5.
hnRNP K and αCPs regulate the proximal promoter of the mouse μ opioid receptor gene. Top, schematic representation of the mouse Oprm1 minimum proximal promoter region, the p340/300 promoter construct. Bottom, neuronal NS20Y cells were cotransfected with 2 μg of the binding protein constructs and 1 μg of the luciferase reporter construct. Luciferase reporter activities were expressed as n-fold relative to the activity of each corresponding luciferase reporter transfected with vector alone, which was assigned an activity value of 1.0. Transfection efficiencies were normalized by β-galactosidase activity. The data shown are the mean of three independent experiments with at least two different plasmid preparations. Error bars indicate the range of standard errors. LUC, luciferase.
F<sc>ig</sc>. 6.
Fig. 6.
Mouse Oprm1 mRNA expression levels in hnRNP K and αCP DNA-transfected NS20Y cells. Relative levels of αCP protein expression following plasmid transfection were confirmed by immunoblot analysis (top panels; lane 1, vector DNA alone; lane 2, 2 μg of plasmid DNA; lane 3, 4 μg of plasmid DNA). Immunoblots against β-actin were performed as an internal control. Each panel is a representative of three separate experiments. Total RNA from NS20Y cells transfected with various amounts (center panels; lane 1, vector DNA alone; lane 2, 2 μg of plasmid DNA; lane 3, 4 μg of plasmid DNA) of the pcDNA4 plasmids for hnRNP K and the αCPs were reverse transcribed into a cDNA and used as a template for PCR with Oprm1 and β-actin PCR primers. PCR products were electrophoresed on a 2% agarose gel, and the relative intensities of the Oprm1 mRNA were normalized against those of β-actin (bottom panels). Quantitative analyses were performed using ImageQuant 5.2 software. Each bar represents the sum of the signal intensities in an area of a defined size and S.D. between experiments. Error bars indicate the range of standard deviation. The signal from vector DNA-translated cells was set at 1. A, pcDNA4-hnRNP K. B, pcDNA4-αCP1. C, pcDNA4-αCP2. D, pcDNA4-αCP2-KL. E, pcDNA4-αCP3.

Similar articles

Cited by

References

    1. Wei, L. N., and Loh, H. H. ( 2002) Regulation of opioid receptor expression. Curr. Opin. Pharmacol. 2, 69–75 - PubMed
    1. Min, B. H., Augustin, L. B., Felsheim, R. F., Fuchs, J. A., and Loh, H. H. ( 1994) Genomic structure analysis of promoter sequence of a mouse μ opioid receptor gene. Proc. Natl. Acad. Sci. U. S. A. 91, 9081–9085 - PMC - PubMed
    1. Kieffer, B. L. ( 1995) Recent advances in molecular recognition and signal transduction of active peptides: receptors for opioid peptides. Cell. Mol. Neurobiol. 15, 615–635 - PMC - PubMed
    1. Kieffer, B. L. ( 1999) Opioids: first lessons from knockout mice. Trends Pharmacol. Sci. 20, 19–26 - PubMed
    1. Law, P. Y., Wong, Y. H., and Loh, H. H. ( 2000) Molecular mechanisms and regulation of opioid receptor signaling. Annu. Rev. Pharmacol. Toxicol. 40, 389–430 - PubMed

Publication types