. 2008 Sep;7(9):1609-38.
doi: 10.1074/mcp.M800016-MCP200. Epub 2008 May 2.

Consequences of C4 differentiation for chloroplast membrane proteomes in maize mesophyll and bundle sheath cells

Affiliations

Consequences of C4 differentiation for chloroplast membrane proteomes in maize mesophyll and bundle sheath cells

Wojciech Majeran et al. Mol Cell Proteomics. 2008 Sep.

Abstract

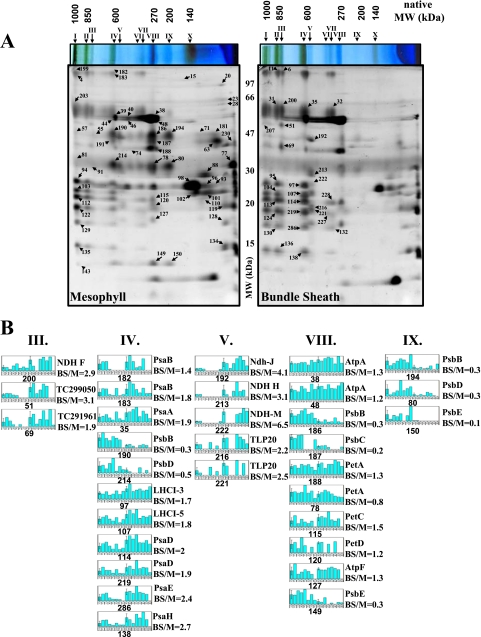
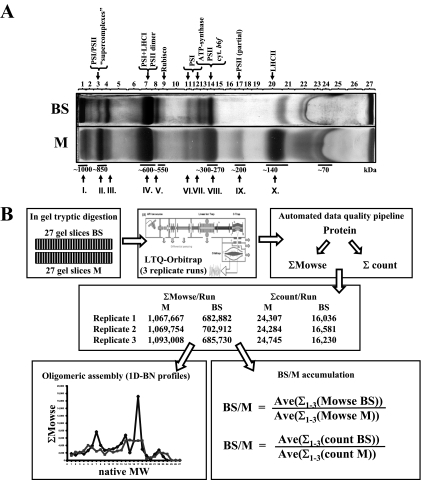
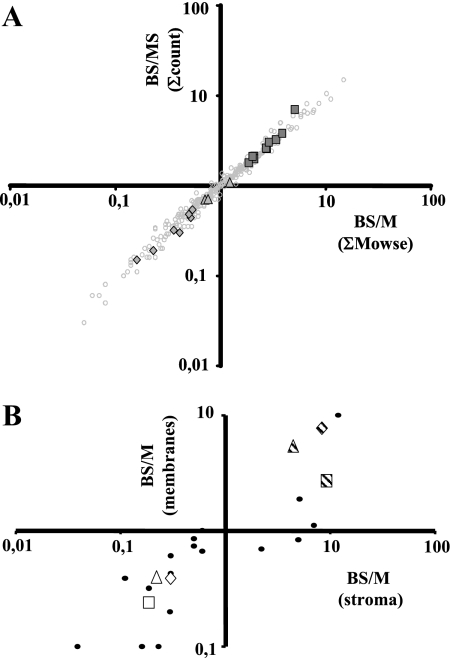
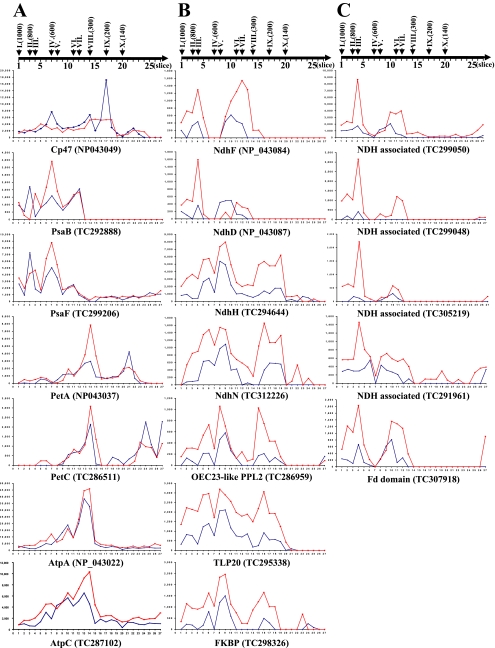
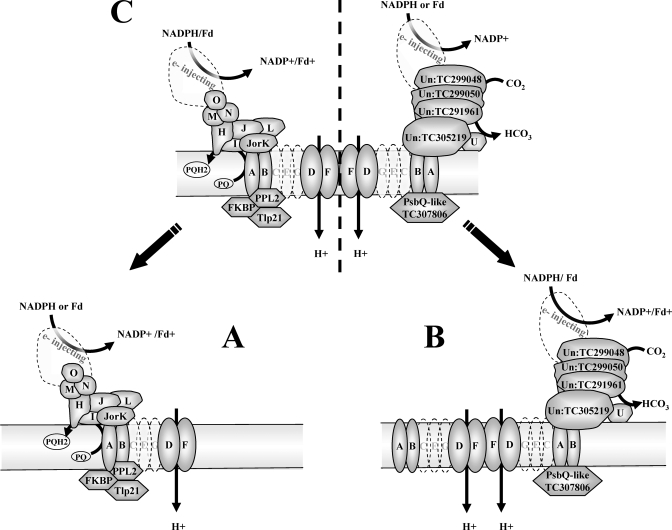
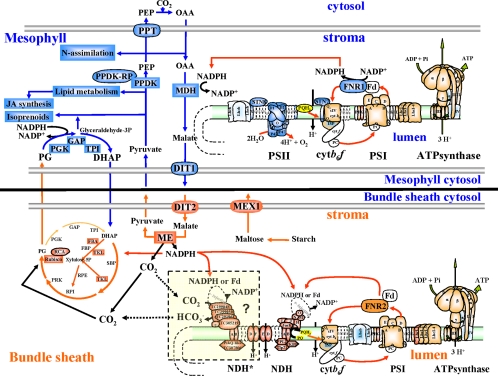
Chloroplasts of maize leaves differentiate into specific bundle sheath (BS) and mesophyll (M) types to accommodate C(4) photosynthesis. Chloroplasts contain thylakoid and envelope membranes that contain the photosynthetic machineries and transporters but also proteins involved in e.g. protein homeostasis. These chloroplast membranes must be specialized within each cell type to accommodate C(4) photosynthesis and regulate metabolic fluxes and activities. This quantitative study determined the differentiated state of BS and M chloroplast thylakoid and envelope membrane proteomes and their oligomeric states using innovative gel-based and mass spectrometry-based protein quantifications. This included native gels, iTRAQ, and label-free quantification using an LTQ-Orbitrap. Subunits of Photosystems I and II, the cytochrome b(6)f, and ATP synthase complexes showed average BS/M accumulation ratios of 1.6, 0.45, 1.0, and 1.33, respectively, whereas ratios for the light-harvesting complex I and II families were 1.72 and 0.68, respectively. A 1000-kDa BS-specific NAD(P)H dehydrogenase complex with associated proteins of unknown function containing more than 15 proteins was observed; we speculate that this novel complex possibly functions in inorganic carbon concentration when carboxylation rates by ribulose-bisphosphate carboxylase/oxygenase are lower than decarboxylation rates by malic enzyme. Differential accumulation of thylakoid proteases (Egy and DegP), state transition kinases (STN7,8), and Photosystem I and II assembly factors was observed, suggesting that cell-specific photosynthetic electron transport depends on post-translational regulatory mechanisms. BS/M ratios for inner envelope transporters phosphoenolpyruvate/P(i) translocator, Dit1, Dit2, and Mex1 were determined and reflect metabolic fluxes in carbon metabolism. A wide variety of hundreds of other proteins showed differential BS/M accumulation. Mass spectral information and functional annotations are available through the Plant Proteome Database. These data are integrated with previous data, resulting in a model for C(4) photosynthesis, thereby providing new rationales for metabolic engineering of C(4) pathways and targeted analysis of genetic networks that coordinate C(4) differentiation.


Figures

F<sc>ig</sc>. 1.
Fig. 1.
2D BN gels from BS and M chloroplast membranes and examples of quantifications. A, BS and M membranes were solubilized with β-DM and first separated based on native mass by BN-PAGE. The focused gel lanes were then denatured, reduced, and alkylated, and proteins were separated based on denatured mass by SDS-PAGE. The resulting 2D-BN gels were stained with Coomassie Blue, and spots were detected, matched, quantified, and normalized against the total spot volume. The analysis was carried out with seven (independent) biological replicates. Proteins in the spots were identified by peptide mass fingerprinting using MALDI-TOF MS and/or by on-line nano-LC-ESI-MS/MS. The mass spectral data were searched against the maize EST assembly from TIGR (ZmGI v16.0). BS/M ratios are listed in Table I. Details of spot quantifications, their estimated 1D and 2D molecular weights, and protein content are shown in supplemental Table 1. Major complexes are indicated by Roman numerals with their BS/M ratio and S.D. as follows: I (mixture of PSI and PSII “supercomplexes”), II (PSI dimer, BS/M = 1.9 ± 0.5), III (complex of unknown function, BS/M = 3.1 ± 0.57), IV (PSI, BS/M = 2 ± 0.38; and PSII dimer, BS/M = 0.4 ± 0.14), V (NDH and Tlp20, BS/M = 3.7 ± 1.7), VI (partially assembled PSI), VII (partially assembled PSI, BS/M = 1.6 ± 0.37), VIII (ATP synthase, BS/M = 1.3 ± 0.05; cytb6f, BS/M = 1.2 ± 0.3; and PSII monomer, BS/M = 0.3 ± 0.05), IX (partially assembled PSII, BS/M = 0.2 ± 0.11), and X (LHCII trimer, BS/M = 0.6). B, examples of quantifications of the major thylakoid complexes: PSI, PSII, cytb6f, ATP synthase, the NDH complex, and the high molecular weight complexes of unknown function (complexes III, IV, V, VIII, and IX). Spot numbers, protein identities, and BS/M spot ratios are indicated. Bar diagrams indicate the following. Bar 1 shows the M average spot volume and S.D. calculated from normalized spots volumes in seven M gels shown in bars 2–8, and bar 9 shows BS average spot volume and S.D. calculated from normalized spots volumes in seven BS gels shown in bars 10–16.
F<sc>ig</sc>. 2.
Fig. 2.
Comparative analysis of BS and M chloroplast membranes by 1D BN-PAGE followed by LC-MS-based quantification of unlabeled peptides. A, BS and M membranes were solubilized with β-DM and separated based on native mass by 1D BN-PAGE. Approximate native molecular mass (below the gel) and the identities of the most abundant complexes (above the gel) are indicated. Roman numerals indicate the most abundant complexes observed in the first dimension of the 2D BN in Fig. 1. Each BN-PAGE lane was cut into 27 bands (indicated above the gel). B, schematic overview of the identification and quantification process. Proteins were denatured, reduced, alkylated, and cleaved by in-gel digestion with trypsin. Extracted peptides were analyzed by data-dependent acquisition nano-LC-ESI-MS/MS. The high accuracy precursor ion masses (in MS) were determined in the Orbitrap (maximum mass error in database search <6 ppm) followed by data-dependent MS/MS in the LTQ part of the instrument. Each sample was analyzed in three replicates. Spectral data were searched against ZmGI v16.0 using Mascot followed by additional filtering and extraction of relevant information. The sum of the number of matched MS/MS spectra (ΣCount) or Mowse scores (ΣMowse) obtained per protein was calculated for each replicate. The BS/M protein ratios were then calculated based on averaged (Ave; across the three replicates) ΣMowse or ΣCounts for each protein per cell type.
F<sc>ig</sc>. 3.
Fig. 3.
Cross-correlation of quantifications of BS/M ratios. A, cross-correlation of the BS/M protein ratios for 290 proteins calculated based on averaged (across the three replicates) ΣMowse score or ΣCounts for each protein per cell type. The BS/MS ratios for the subunits of the NDH complex (squares) and the PSII core complex of chloroplast-encoded (triangles) and nucleus-encoded (diamonds) subunits are highlighted in the overall population of quantified accessions (circles). B, cross-correlation of the BS/M protein ratios for proteins characterized in the comparative analysis of BS and M chloroplast stromal proteomes (8) and our current thylakoid data set. A direct comparison was obtained for 23 proteins (circles). Average BS/M ratios across the methods were used. Examples of markers of the C4 carbon fixation pathway are highlighted for the following: PPDK, BS/M = 0.4 (open triangle); MDH, BS/M = 0.24 (open square); GAPB, BS/M = 0.39 (open diamond); RBCL, BS/M = 2.71 (striped square); RBCS, BS/M = 7.69 (striped diamond); and RCA, BS/M = 5.42 (striped triangle). Proteins that were only identified in M or BS were assigned a ratio of 0.1 and 10, respectively.
F<sc>ig</sc>. 4.
Fig. 4.
Profiles of oligomeric state of selected proteins determined by 1D BN-PAGE and MS analysis. For each protein the ΣMowse per gel slice for BS (in red) and M (in blue) are represented. Slices were numbered (as indicated by the scale on top of each panel) following a decreasing native molecular weight. Roman numerals indicate the major thylakoid complexes as described in Fig. 1 with approximate native molecular weight indicated in parentheses. A, examples of 1D BN profiles for subunits of PSII (CP47), PSI (PsaB,F), cytb6f (PetA,C), and ATP synthase (AtpA,C). B, 1D BN profiles of two membrane-embedded (NdhD and -F), two connecting complex subunits (NdhH and -N) of the NDH complex, and potential interacting partners co-migrating with the NDH-connecting complex subunits (PPL2, TLP20, and FKBP). C, 1D BN profiles for four unknown proteins co-migrating in a BS-localized 800-kDa high molecular mass complex and potentially interacting with Fd-like or NdhU and NDH membrane-embedded subunits.
F<sc>ig</sc>. 5.
Fig. 5.
Schematic representation of the suggested oligomeric organization of the NDH complex and potential interacting proteins. Co-migration of proteins was deduced from peaks observed on 1D BN profiles (see also supplemental Tables 3 and 4 and examples of profiles in Fig. 4C). A, the ∼550-kDa complex represents the NDH monomer with the connecting complex (the classical L-shaped complex observed for mitochondrial complex I) and three associated lumenal proteins (PPL2 (TC289659), Tlp20 (TC295339), and FKBP (TC298326)). B, the ∼800-kDa complex represents a dimeric membrane-embedded complex with the associated new complex postulated to be involved in CCM. C, the ∼1000-kDa complex represents the U-shaped NDH complex with both the connecting complex and the newly associated complex. Possible electron donors, CO2 hydration, and proton translocation are indicated. Un, unknown
F<sc>ig</sc>. 6.
Fig. 6.
Simplified overview of the differential expression of major thylakoid and envelope functions between the M and BS chloroplasts. Photosynthetic complexes as well as number of auxiliary photosynthetic and metabolic functions associated with the thylakoids and envelopes are listed. Protein BS/M accumulation ratios are represented as color-coding for M (BS/M < 0.5, dark blue; 0.6 < BS/M < 0.8, light blue) and for BS preferential accumulation (1.2 < BS/M < 2, light orange; BS/M > 2, purple). Proteins that did not show differential accumulation are represented in white (0.8 < BS/M < 1.2), and those that were not quantified are shown as transparent (dashed lines). Abbreviations are listed in Table I except for sedoheptulose-1,7-bisphosphatase (SBP), ribulose-5-phosphate isomerase (RPI), fructose bisphosphatase (FBP), dihydroxyacetone (DHAP), phosphoglycerate (PG), and oxaloacetate (OAA). The solid line indicates the cells walls of adjacent BS and M cells. The reduced amounts of PSII and NDH complexes in BS and M thylakoids, respectively, are not shown. NDH* (yellow-shaded area) represents a suggested organization of the U-shaped NDH complex containing a symmetric novel arm subcomplex (NDH*) that we speculate is involved in hydration of CO2 into HCO3.

Similar articles

Cited by

References

    1. Hall, L. N., Rossini, L., Cribb, L., and Langdale, J. A. ( 1998) GOLDEN 2: a novel transcriptional regulator of cellular differentiation in the maize leaf. Plant Cell 10, 925–936 - PMC - PubMed
    1. Roth, R., Hall, L. N., Brutnell, T. P., and Langdale, J. A. ( 1996) bundle sheath defective2, a mutation that disrupts the coordinated development of bundle sheath and mesophyll cells in the maize leaf. Plant Cell 8, 915–927 - PMC - PubMed
    1. Brutnell, T. P., Sawers, R. J., Mant, A., and Langdale, J. A. ( 1999) BUNDLE SHEATH DEFECTIVE2, a novel protein required for post-translational regulation of the rbcL gene of maize. Plant Cell 11, 849–864 - PMC - PubMed
    1. Covshoff, S., Majeran, W., Liu, P., Kolkman, J. M., van Wijk, K. J., and Brutnell, T. P. ( 2008) Deregulation of maize C4 photosynthetic development in a mesophyll cell-defective mutant. Plant Physiol. 146, 1469–1481 - PMC - PubMed
    1. Sheen, J. ( 1999) C-4 gene expression. Annu. Rev. Plant Physiol. Plant Mol. Biol. 50, 187–217 - PubMed

Substances

LinkOut - more resources