Review
. 2008 May 1;5(4):393-405.
doi: 10.1513/pats.200801-013ET.

National Emphysema Treatment Trial: the major outcomes of lung volume reduction surgery in severe emphysema

Affiliations
Review

National Emphysema Treatment Trial: the major outcomes of lung volume reduction surgery in severe emphysema

Gerard J Criner et al. Proc Am Thorac Soc. .

Abstract

The National Emphysema Treatment Trial (NETT) has published many articles reporting the various outcomes of lung volume reduction surgery versus medical treatment for patients with severe emphysema. However, long and complex clinical trials like NETT that involve both medical and surgical issues generate multiple manuscripts over a period of years and report an array of various outcomes. As a result, the essential findings of the trial may appear to be fragmented to the clinician or clinical researcher or be lost among the many medical reports published each year. In this review, we summarize in one publication the major medical and surgical outcomes of NETT.


Figures
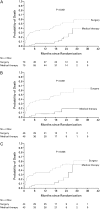
<b>Figure 1.</b>
Figure 1.
Kaplan-Meier estimates of the probability of death among high-risk patients, according to whether they were randomly assigned to undergo lung volume reduction surgery or receive medical therapy. This intention-to-treat analysis shows the overall results for the high-risk group (A), the subgroup of patients with an FEV1 that was no more than 20% of their predicted value and a homogeneous distribution of emphysema on computed tomography scanning (B), and the subgroup of patients with an FEV1 that was no more than 20% of its predicted value and a carbon monoxide diffusing capacity that was no more than 20% of its predicted value (C). For each analysis, the difference between groups was significant (P < 0.001, P < 0.001, P = 0.005, respectively) by the log-rank test. Reprinted by permission from Reference .
<b>Figure 2.</b>
Figure 2.
Sensitivity analysis of sex-specific cutoff points for subgroups defined according to maximal workload. Graph shows the risk ratio (lung volume reduction surgery [LVRS] vs. medical) for percentile cutoff points of baseline maximal workload, ranging from the 10th percentile to the 70th percentile in 5-percentile steps. The cutoff points for a given patient vary according to sex; for example, the 40th percentile for baseline maximal workload for women was 25 W, whereas the 40th percentile for men was 40 W. This graph suggests the 40th percentile of baseline maximal workload as the cutoff point beyond which the risk ratio increases. Reprinted by permission from Reference .
<b>Figure 3.</b>
Figure 3.
Kaplan-Meier estimates of the probability of death as a function of the number of months after randomization. P values were derived by Fisher's exact test for the comparison between groups over a mean follow-up period of 29.2 months. High-risk patients were defined as those with an FEV1 ⩽ 20% predicted and either homogeneous emphysema or DlCO ⩽ 20% predicted. A low baseline exercise capacity was defined as a maximal workload at or below the sex-specific 40th percentile (25 W for women and 40 W for men); a high exercise capacity was defined as a workload above this threshold. This was an intention-to-treat analysis. Reprinted by permission from Reference .
<b>Figure 4.</b>
Figure 4.
Histograms of changes from post–rehabilitation baseline in exercise capacity (maximal workload), percentage of predicted value for FEV1, distance walked in 6 minutes, health-related quality of life (St. George's Respiratory Questionnaire), quality of life (Quality of Well-Being Scale), and dyspnea (University of California, San Diego [UCSD], Shortness of Breath Questionnaire) after 6, 12, and 24 months of follow-up for all patients shown in the first, second, and third rows of data, respectively. The category “missing” includes patients who were too ill to complete the procedure or who declined to complete the procedure but did not explain why. For the Quality of Well-Being Scale, patients who died were assigned a score of 0 on the questionnaire for the visit, and patients who did not complete the questionnaire were assigned a score equal to half the lowest score observed for the visit. P values were determined by the Wilcoxon rank-sum test. The degree to which the bars are shifted to the upper left of the chart indicates the degree of relative benefit of lung volume reduction surgery over medical treatment. The percentage shown in each quadrant is the percentage of patients in the specified treatment group with a change in the outcome falling in that quadrant. This is an intention-to-treat analysis. Reprinted by permission from Reference .
<b>Figure 5.</b>
Figure 5.
Kaplan-Meier estimates of the cumulative probability of death as a function of years after randomization to lung volume reduction surgery (LVRS) (gray line) or medical treatment (black line) for (A) all patients and (BD) non–high-risk and upper lobe–predominant subgroups of patients. The P value is from the Fisher's exact test for difference in the proportions of patients who died during the 4.3 years (median) of follow-up. Shown below each graph are the numbers of patients at risk, the Kaplan-Meier probabilities, the ratio of the probabilities (LVRS:medical), and P value for the difference in these probabilities. This is an intention-to-treat analysis. (A) All patients (n = 1,218). (B) Non–high-risk patients (n = 1,078). (C) Upper lobe predominant and low baseline exercise capacity (n = 290). (D) Upper lobe predominant and high exercise capacity (n = 419). RR = relative risk. Reprinted by permission from Reference .
<b>Figure 6.</b>
Figure 6.
Improvement in exercise capacity (increase in maximum work of >10 W above the patient's post–rehabilitation baseline) at 1, 2, and 3 years after randomization to lung volume reduction surgery (LVRS) (open bars) or medical treatment (solid bars) for (A) all patients and (BD) non–high-risk and upper lobe–predominant subgroups of patients. Shown below each graph are the numbers of patients evaluated, the odds ratio for improvement (LVRS:medical), and the Fisher's exact P value for difference in proportion improved. Patients who died or who did not complete the assessment were considered not improved. This is an intention-to-treat analysis. (A) All patients (n = 1,218). (B) Non–high-risk patients (n = 1,078). (C) Upper lobe predominant and low baseline exercise capacity (n = 290). (D) Upper lobe predominant and high exercise capacity (n = 419). Reprinted by permission from Reference .
<b>Figure 7.</b>
Figure 7.
Improvement in health-related quality of life (decrease in St. George's Respiratory Questionnaire total score of >8 units below the patient's post–rehabilitation baseline) at 1, 2, 3, 4, and 5 years after randomization to lung volume reduction surgery (LVRS) (open bars) or medical therapy (solid bars) for (A) all patients and (BD) non–high-risk and upper lobe–predominant subgroups of patients. Shown below each graph are the numbers of patients evaluated, the odds ratio for improvement (LVRS:medical), and the Fisher's exact P value for difference in proportion improved. Patients who died or who did not complete the assessment were considered not improved. This is an intention-to-treat analysis. (A) All patients (n = 1,218). (B) Non–high-risk patients (n = 1,078). (C) Upper lobe predominant and low baseline exercise capacity (n = 290). (D) Upper lobe predominant and high exercise capacity (n = 419). Reprinted by permission from Reference .
<b>Figure 8.</b>
Figure 8.
The number of patients (in 496/552 lung volume reduction surgery [LVRS] patients who had detailed data on air leak duration) who stopped leaking air via chest tubes (#, y axis) per postoperative day for the first 30 days post-LVRS. The number of patients with air leak persisting at least 30 days is shown in the extreme right-hand bar. Reprinted by permission from Reference .

Similar articles

Cited by

References

    1. National Emphysema Treatment Trial Research Group. A randomized trial comparing lung-volume-reduction surgery with medical therapy for severe emphysema. N Engl J Med 2003;348:2059–2073. - PubMed
    1. Naunheim KS, Wood DE, Mohsenifar Z, Sternberg AL, Criner GJ, DeCamp MM, Deschamps CC, Martinez FJ, Sciurba FC, Tonascia J, et al. Long-term follow-up of patients receiving lung-volume-reduction surgery versus medical therapy for severe emphysema. Ann Thorac Surg 2006;82:431–443. - PubMed
    1. DeCamp MM, Blackstone EH, Naunheim KS, Krasna MJ, Wood DE, Meli YM, McKenna RJ; for the NETT Research Group. Patient and surgical factors influencing air leak after lung volume reduction surgery: lessons learned from the National Emphysema Treatment Trial. Ann Thorac Surg 2006;82:197–207. - PubMed
    1. Naunheim KS, Wood, DE, Krasna MJ, Decamp MM, Ginsburg ME, McKenna RJ, Criner GJ, Hoffman EA, Sternberg AL, Deschamps CC; for the National Emphysema Treatment Trial Research Group. Predictors of operative mortality and cardiopulmonary morbidity in the National Emphysema Treatment Trial. J Thorac Cardiovasc Surg 2006;131:43–53. - PubMed
    1. National Emphysema Treatment Trial Research Group. Safety and efficacy of median sternotomy versus video-assisted thoracic surgery for lung volume reduction surgery. J Thorac Cardiovasc Surg 2004;127:1350–1360. - PubMed

Publication types

LinkOut - more resources