. 2008 May 15;180(10):6467-71.
doi: 10.4049/jimmunol.180.10.6467.

Cutting edge: expression of TNFR2 defines a maximally suppressive subset of mouse CD4+CD25+FoxP3+ T regulatory cells: applicability to tumor-infiltrating T regulatory cells

Affiliations

Cutting edge: expression of TNFR2 defines a maximally suppressive subset of mouse CD4+CD25+FoxP3+ T regulatory cells: applicability to tumor-infiltrating T regulatory cells

Xin Chen et al. J Immunol. .

Abstract

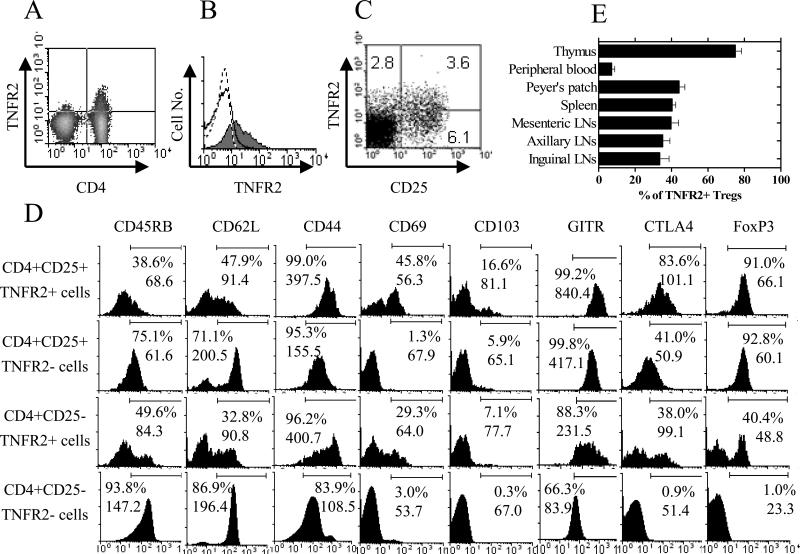
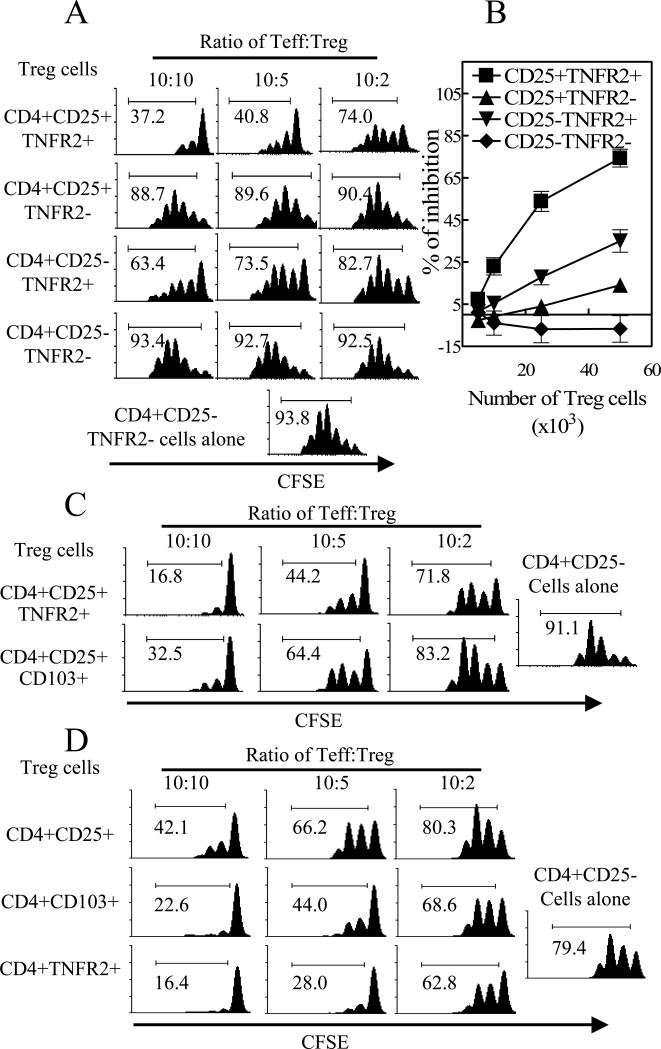
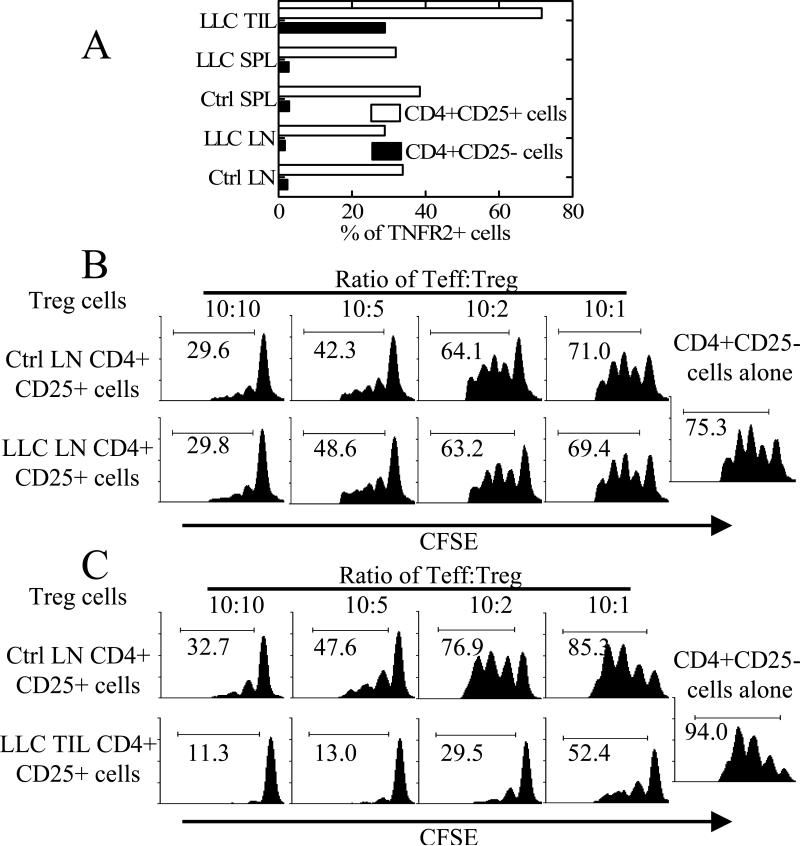
TNFR2 is predominantly expressed by a subset of human and mouse CD4(+)CD25(+)FoxP3(+) T regulatory cells (Tregs). In this study, we characterized the phenotype and function of TNFR2(+) Tregs in peripheral lymphoid tissues of normal and tumor-bearing C57BL/6 mice. We found that TNFR2 was expressed on 30-40% of the Tregs of the peripheral activated/memory subset that were most highly suppressive. In contrast, TNFR2(-) Tregs exhibited the phenotype of naive cells and only had minimal suppressive activity. Although not typically considered to be Tregs, CD4(+)CD25(-)TNFR2(+) cells nevertheless possessed moderate suppressive activity. Strikingly, the suppressive activity of TNFR2(+) Tregs was considerably more potent than that of reportedly highly suppressive CD103(+) Tregs. In the Lewis lung carcinoma model, more highly suppressive TNFR2(+) Tregs accumulated intratumorally than in the periphery. Thus, TNFR2 identifies a unique subset of mouse Tregs with an activated/memory phenotype and maximal suppressive activity that may account for tumor-infiltrating lymphocyte-mediated immune evasion by tumors.


Figures

Figure 1
Figure 1. Phenotypic characterization and distribution of normal C57BL/6 mouse CD4+CD25+TNFR2+ Tregs
(A) Splenocytes were stained with anti CD4 and TNFR2 Abs and analyzed by FACS. (B) Splenocytes were stained with anti CD3, CD4, CD25 and TNFR2 Abs. The expression of TNFR2 by CD4+CD25+ cells (grey histogram) and CD4+CD25 cells (solid line histogram) was analyzed by FACS, gating on CD3+ cells. Dashed line represents isotype control. (C) Splenocytes were stained with anti CD3, CD4, CD25 and TNFR2. Expression of CD25 and TNFR2 was analyzed with FACS by gating on CD3+CD4+ cells. (D) Splenocytes were stained with anti CD4, CD25, TNFR2 and CD45RB, or CD62L, or CD44, or CD69, or CD103, or GITR, or CTLA-4, or FoxP3 Abs. CTLA-4 and FoxP3 were stained intracellularly. Expression of phenotypic markers was analyzed with FACS by gating on indicated CD4 subsets. (E) Cells from indicated lymphoid tissues and peripheral blood were stained with anti CD3 (or CD8 for thymocytes), CD4, CD25 and TNFR2 Abs. The percentage of TNFR2+ cells was analyzed with FACS by gating on CD3+CD4+CD25+ population (except for thymocytes which were gated on CD8CD4+CD25+ cells). Error bars indicate SE derived from 3 mice (n=3). Numbers in the quadrants represent percentage of positive staining cells (%).The numbers in the histograms show percentage of positive cells (%) and MFI. Data shown are representatives of at least 3 separate experiments with similar results.
Figure 2
Figure 2. CD4+CD25+TNFR2+ T cells were highly potent suppressor cells
Flow-sorted CD4+CD25TNFR2 or CD4+CD25 T cells (5×10⁴ cells/well) were labeled with CFSE and cultured alone or co-cultured with indicated number or ratio of flow-sorted CD4 subsets from spleen and LNs of normal C57BL/6 mice. The percentage of CFSE-diluted cells was shown in the histograms. (A), (C) and (D) show a representative data of at least 3 separate experiments with similar results and (B) shows summary of percent inhibition of replication (%) from 6 separate experiments.
Figure 3
Figure 3. Highly suppressive TNFR2+ Tregs accumulated in the TILs of LLC mouse model
(A) LN cells, spleen cells (SPL) and TILs from LLC tumor bearing mice were stained with CD4, CD25 and TNFR2. Expression of TNFR2 was analyzed with FACS by gating on CD4+CD25+ or CD4+CD25 cells from LLC bearing mouse TIL (LLC TIL) or spleen (LLC SPL) or LNs (LLC LN) or from tumor free C57BL/6 mouse spleen (Ctrl SPL) or LNs (Ctrl LN). (B-C) CD4+CD25 T cells from normal control mouse LNs (5×10⁴ cells/well) were labeled with CFSE and cultured alone or co-cultured with indicated source of Tregs at desired ration. The percentage of CFSE-diluted cells was shown in the histograms. Data shown are representatives of 3 separate experiments with similar results.

References

    1. Aggarwal BB. Signalling pathways of the TNF superfamily: a double-edged sword. Nat Rev Immunol. 2003;3:745–756. - PubMed
    1. Szlosarek PW, Balkwill FR. Tumour necrosis factor alpha: a potential target for the therapy of solid tumours. Lancet Oncol. 2003;4:565–573. - PubMed
    1. Chen X, Baumel M, Mannel DN, Howard OM, Oppenheim JJ. Interaction of TNF with TNF Receptor Type 2 Promotes Expansion and Function of Mouse CD4+CD25+ T Regulatory Cells. J Immunol. 2007;179:154–161. - PubMed
    1. Annunziato F, Cosmi L, Liotta F, Lazzeri E, Manetti R, Vanini V, Romagnani P, Maggi E, Romagnani S. Phenotype, localization, and mechanism of suppression of CD4(+)CD25(+) human thymocytes. J Exp Med. 2002;196:379–387. - PMC - PubMed
    1. Lehmann J, Huehn J, de la Rosa M, Maszyna F, Kretschmer U, Krenn V, Brunner M, Scheffold A, Hamann A. Expression of the integrin alpha Ebeta 7 identifies unique subsets of CD25+ as well as CD25- regulatory T cells. Proc Natl Acad Sci U S A. 2002;99:13031–13036. - PMC - PubMed

Publication types

MeSH terms

Substances