. 2008 May 15;180(10):6566-76.
doi: 10.4049/jimmunol.180.10.6566.

Preferential costimulation by CD80 results in IL-10-dependent TGF-beta1(+) -adaptive regulatory T cell generation

Affiliations

Preferential costimulation by CD80 results in IL-10-dependent TGF-beta1(+) -adaptive regulatory T cell generation

Nicolas Perez et al. J Immunol. .

Abstract

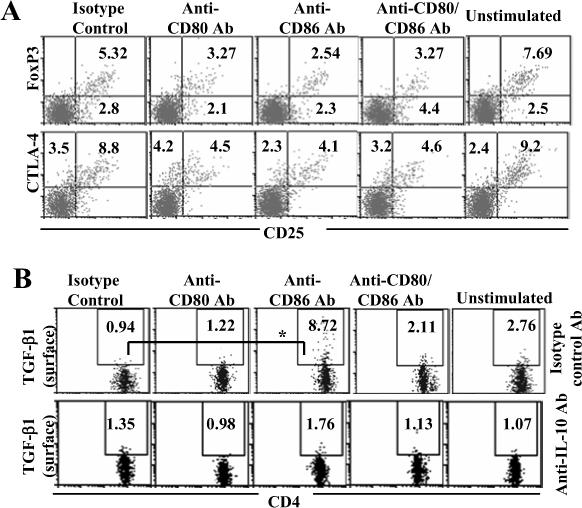
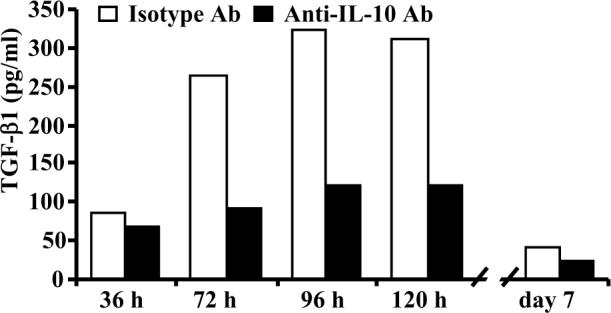
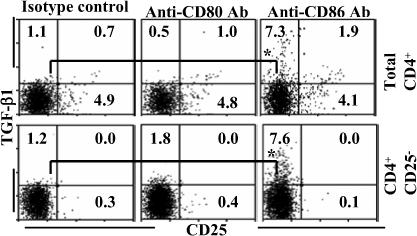
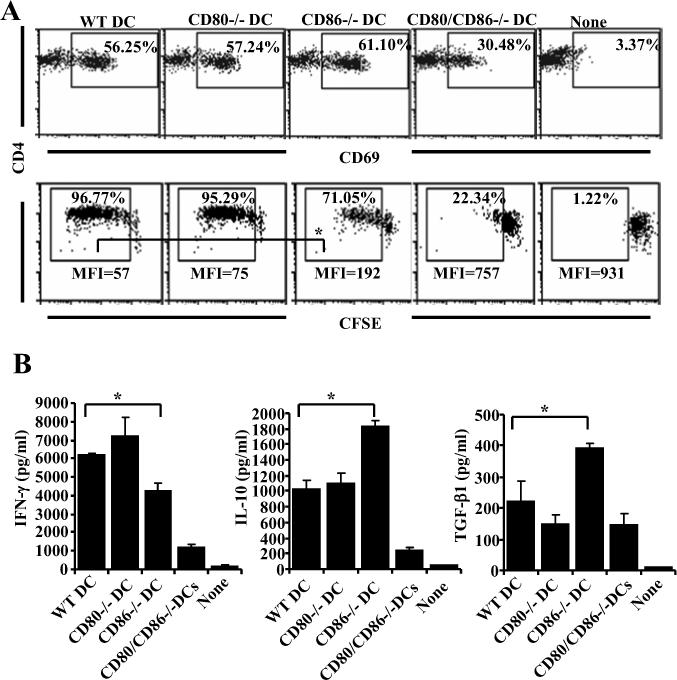
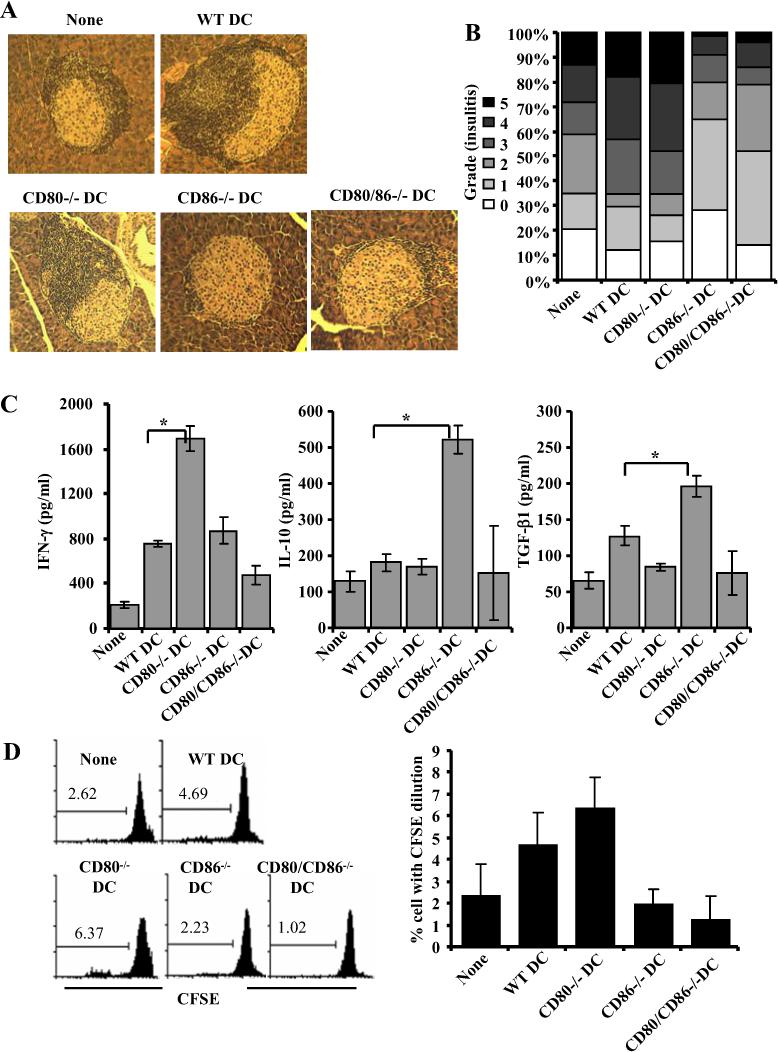
Costimulatory ligands CD80 and CD86 have different binding preferences and affinities to their receptors, CD28 and CTLA-4. Earlier, we demonstrated that CD80 binds to CTLA-4 with higher affinity and has a role in suppressing T cell response. The current study demonstrates that not only did blockade of CD86 upon Ag presentation by bone marrow-derived dendritic cells (DC) to OVA-specific T cells result in induction of hyporesponsive T cells but also that these T cells could suppress the proliferative response of effector T cells. These T cells showed TGF-beta1 on their surface and secreted TGF-beta1 and IL-10 upon restimulation. Although blockade of CTLA-4 and neutralization of IL-10 profoundly inhibited the induction of these TGF-beta1(+) T cells, their ability to suppress the effector T cell proliferation was abrogated by neutralization of TGF-beta1 alone. Induction of TGF-beta1(+) and IL-10(+) T cells was found to be independent of natural CD4(+)CD25(+) regulatory T cells, demonstrating that preferential ligation of CTLA-4 by CD80 induced IL-10 production by effector T cells, which in turn promoted the secretion of TGF-beta1. Treatment of prediabetic NOD mice with islet beta cell Ag-pulsed CD86(-/-) DCs, but not CD80(-/-) DCs, resulted in the induction of TGF-beta1- and IL-10-producing cells, significant suppression of insulitis, and delay of the onset of hyperglycemia. These observations demonstrate not only that CD80 preferentially binds to CTLA-4 but also that interaction during Ag presentation can result in IL-10-dependent TGF-beta1(+) regulatory T cell induction, reinstating the potential of approaches to preferentially engage CTLA-4 through CD80 during self-Ag presentation in suppressing autoimmunity.


Figures

FIGURE 1
FIGURE 1
Preferential co-stimulation through CD80 and CD86 upon antigen presentation results in difference in proliferative responses by effector T cells. DCs generated in vitro from BM cells using GM-CSF and IL-4, and exposed to bacterial LPS (1 μg/ml) for 24 h were used as antigen presenting cells. A) These DCs were tested for activation markers by FACS (left panel), and cytokine production in the culture supernatants upon 24 h LPS activation by luminex multiplex assay (right panel). For FACS analysis, cells were stained using FITC labeled anti-mouse CD11c Ab and PE- labeled anti-mouse CD80, CD86 CD40 or I-Ad Ab. CD11c+ Cells were gated for the graphs shown. Thin-line and thick-line histograms indicate isotype control Ab and marker specific Ab staining respectively. Purified splenic CD4+ T cells from OVA primed mice were incubated with OVA pulsed BMDCs in the presence of anti-mouse CD80 and CD86 blocking Abs individually or in combination. B) After 16 h, early activation marker (CD69) was examined on CD4+ T cells from these cultures by staining with fluorochrome labeled anti-CD4 and CD69 Abs followed by FACS. E) CFSE labeled CD4+ T cells stimulated similarly using OVA pulsed BMDCs for 5 days were tested for CFSE dilution by FACS following staining with PE-labeled anti-CD4 Ab. CD4+ T cells were gated for panels B and C. These assays were repeated 4 times in triplicate with similar results. * indicates a p value of <0.05. Varying concentrations of blocking Abs were used in the initial assays; however, results from the assay using saturating concentration (10 μg/ml) of Abs are shown throughout.
FIGURE 2
FIGURE 2
Preferential co-stimulation by CD80 and CD86 induces different cytokine profiles by effector T cells. Co-stimulation blockade assay was carried as described for Fig 1. Supernatants collected from 36 h cultures were tested for cytokines by luminex multiplex assay. Mean±SD of values from three individual experiments carried out in triplicate are shown. This assay was repeated 4 times with similar results. * indicates a p value of <0.05.
FIGURE 3
FIGURE 3
Dominant co-stimulation by CD80 results in the generation of hyporesponsive T cells with regulatory function. Co-stimulation blockade assay was carried out as described for Fig. 1 with or without anti-CD80 and/or anti-CD86 Ab. On day 5, CD4+ T cells from these primary cultures were obtained using magnetic bead based negative selection kit, and used in the following experiments. A) Cells were labeled with CFSE, incubated with OVA pulsed APCs for additional 5 days, stained with PE-labeled anti-CD4 Ab and tested for CFSE dilution by FACS. B) Culture supernatants from assay A were tested for cytokines by Luminex multiplex and ELISA assays. CD4+ T cells were gated for panels A and representative values are shown. Mean±SD of values from three individual experiments carried out in triplicate are shown for panel B. This assay was repeated at least 4 times with similar results. * indicates a p value of <0.05.
FIGURE 4
FIGURE 4
Hyporesponsive T cells generated upon co-stimulation by CD80 exhibit regulatory properties. Co-stimulation blockade assay was carried out as described for Fig. 1. CD4+ T cells from this culture were incubated with OVA pulsed APCs and CFSE labeled total T cells from OVA primed mice (effector cells) for additional 5 days, stained with PE labeled anti-CD4 or CD8 Abs, and examined for CFSE dilution in effector populations. Representative values are shown. This assay was repeated at least 4 times with similar results. * indicates a p value of <0.05.
FIGURE 5
FIGURE 5
TGF-β1+ T cells, but not CD25+ or Foxp3+ T cells, are induced upon dominant co-stimulation by CD80. Co-stimulation blockade cultures were carried out as described in Fig 1. On day 5, cells from these primary cultures were washed, incubated with fresh medium for additional 48 h. A) These cells were stained for surface CD4 and CD25, and intracellular Foxp3 and CTLA-4, and analyzed by FACS. B) Purified CD4+ T cells from OVA primed mice were cultured as described above in the presence of additional antibodies (isotype control or neutralizing Ab against IL-10). Cells from these cultures were washed on day 5, cultured for an additional 48 h, and tested for CD4+ T cells positive for surface TGF-β1 by FACS. Samples were gated for CD4+ population for the panels A and B. Frequencies of CD4+CD25+Foxp3+ and CD4+CD25+CTLA-4+ cells are shown in panel A and CD4+TGF-β+ cells in panel B. These assays were repeated 4 times in triplicate with similar results and representative values are shown. * indicates a p value of <0.05.
FIGURE 6
FIGURE 6
TGF-β1 secretion by T cells upon CD86 blockade is a late response. Costimulatory blockade cultures were carried out in the presence of anti-CD86 blocking Ab and anti-IL-10 neutralizing Ab as described for Fig 5B. Culture supernatants collected at different time points were tested for TGF-β1 by ELISA. This assay were repeated at least 4 times in triplicate with similar results and representative values are shown. * indicates a p value of <0.05.
FIGURE 7
FIGURE 7
TGF-β1+ T cells are induced as a result of dominant engagement of CTLA-4 by CD80. Co-stimulation blockade cultures were carried out as described for Fig. 1. In addition, these cultures were added with FAb fragments of isotype control or anti-CTLA-4 Ab. A) On day 5, cells from these cultures were washed, cultured for an additional 48 h, and tested for CD4+ T cells positive for surface TGF-β1 by FACS. Samples were gated for CD4+ population for the graphs shown here. Frequencies of CD4+TGF-β+ cells are shown. This assay was repeated 2 times in triplicate with similar results and representative values are shown. B) Supernatants collected from 48 h cultures were tested for IL-10 by ELISA. Mean±SD of triplicate values of 3 individual assays are shown. * indicates a p value of <0.05.
FIGURE 8
FIGURE 8
TGF-β1 plays a dominant role in the suppressive effect of T cells resulting from dominant co-stimulation by CD80. Co-stimulation blockade cultures were carried as described for Fig 1 for 5 days, CD4+ T cells were purified, and co-cultured with CFSE labeled CD4+ T cells from OVA primed mice and OVA pulsed APCs as described for Fig. 4. Isotype control, or neutralizing Abs against IL-10 or TGF-β1 were also added to these co-culture wells. A) Cells from these culture wells were stained for CD4 and the CFSE dilution pattern of effector T cell population was examined on day 5. B and C) Supernatants from above cultures were tested for IL-2 and IFN-γ by Luminex cytokine assay. D) Purified CD4+ T cells from CD86 blockade culture were further fractionated into TGF-β1+ and TGF-β1- rich populations based on the surface TGF-β1 level using anti-TGF-β1-biotin, streptavidin-PE and anti-PE Ab linked magnetic bead reagents (upper panel), co-cultured with effector T cells from OVA primed mice at 1:1 effector:Treg ratio along with OVA pulsed APCs and analyzed (lower panel) as described for Fig. 4. E) Total CD4+ T cells and enriched T cell populations (2.5 ×10⁵ T cells/well) were re-stimulated with OVA pulsed APCs and 36 h culture supernatants were tested for cytokines as described for Fig. 3. These assays were repeated 2−3 times in triplicate with similar results and representative values for panel A and D, and mean±SD values from three individual experiments carried out in triplicate for panels B, C and E are shown. * indicates a p value of <0.05.
FIGURE 9
FIGURE 9
Natural CD4+CD25+ Tregs do not play a significant role in inducing adaptive Tregs with surface bound TGF-β1. CD4+ T cells or CD4+CD25 T cells were cultured in the presence of OVA pulsed BMDCs and blocking Abs as described for Fig. 1. On day 5, cells from these cultures were washed, cultured for an additional 48 h, and tested for CD4+ T cells positive for surface TGF-β1 by FACS after staining using fluorochrome labeled CD4, CD25 and TGF-β1 specific Abs. Samples gated for CD4+ population are shown. This assay was repeated 3 times in triplicate with similar results and representative values are shown. * indicates a p value of <0.05.
FIGURE 10
FIGURE 10
Antigen presentation by CD86−/− DCs induces IL-10 and TGF-β1 producing T cells. DCs were generated from BM of 8-week old wild-type, CD80−/−, CD86−/− and CD80/CD86−/− mice, pulsed with BDC2.5 peptides and incubated with purified CD4+ T cells from BDC2.5 peptide primed NOD.BDC2.5 TCR-Tg mice. A) After 16 h, early activation marker (CD69) was tested on CD4+ T cells from these cultures following staining with fluorochrome labeled anti-CD4 and CD69 Abs by FACS (upper panel). CFSE labeled CD4+ T cells stimulated similarly using peptide pulsed BMDCs for 5 days were tested for CFSE dilution by FACS after staining with PE-labeled anti-CD4 Ab (lower panel). B) Supernatants collected from 72 h cultures were tested for cytokines by luminex multiplex assay or by ELISA. CD4+ T cells were gated for panels A and B. Mean±SD of values from three individual experiments carried out in triplicate are shown for panel B. This assay was repeated 3 times in triplicate with similar results. * indicates a p value of <0.05.
FIGURE 11
FIGURE 11
β-cell antigen presentation by CD86−/− DCs delays the onset of hyperglycemia in NOD mice. DCs were generated from BM of 8-week old wild-type, CD80−/−, CD86−/− and CD80−/−CD86−/− mice, pulsed with immunodominant β cell peptides, injected i.v. into 7−8 week old NOD mice (2×10⁶ cells/mouse) twice at 15 day interval. A) Mice were bled every week for up to 16 weeks post-injection to monitor blood glucose levels. Mice that showed glucose levels >250 mg/dl for two consecutive weeks were considered diabetic. 10−12 mice were included in each group.
FIGURE 12
FIGURE 12
CD86−/− DCs suppress insulitis in NOD mice through induction of IL-10 and TGF-β1 producing T cells. BMDCs from wild-type, CD80−/−, CD86−/− and CD80−/−CD86−/− mice, pulsed with immunodominant β cell peptides, injected i.v. into 7−8 week old NOD mice (2×10⁶ cells/mouse) twice at 15 days interval. Sets of three recipient mice/group were examined for insulitis and T cell response 21 days after DC transfer. A and B) H&E stained pancreatic sections were examined in a blinded fashion and the severity of lymphocyte infiltration was scored as described in materials and methods. Representative islet is shown for each group (A). The percentages of islets with different levels of lymphocyte infiltration are shown (B). C) Spleen cells were incubated with immunodominant peptides, spent medium collected from 72 h cultures were tested for IFN-γ, IL-10 and TGF-β1 by multiplex assay or ELISA. Mean±SD values of cells from 3 mice tested in triplicate are shown. D) CFSE labeled spleen cells were incubated with immunodominant peptides for 5 days, CFSE dilution in CD4+ T cells was examined by FACS after staining using fluorochrome labeled CD4 specific Ab. Representative panels (left panel) and mean±SD (right panel) from assays carried out using three individual mice in triplicate are shown. * indicates a p value of <0.05.

Similar articles

Cited by

References

    1. Lenschow DJ, Walunas TL, Bluestone JA. CD28/B7 system of T cell costimulation. Annu. Rev. Immunol. 1996;14:233–258. - PubMed
    1. Yi-qun Z, Lorre K, de Boer M, Ceuppens JL. B7-blocking agents, alone or in combination with cyclosporin A, induce antigen-specific anergy of human memory T cells. J. Immunol. 1997;158:4734–4740. - PubMed
    1. Gimmi CD, Freeman GJ, Gribben JG, Gray G, Nadler LM. Human T-cell clonal anergy is induced by antigen presentation in the absence of B7 costimulation. Proc. Natl. Acad. Sci. USA. 1993;90:6586–6590. - PMC - PubMed
    1. Walunas TL, Lenschow DJ, Bakker CY, Linsley PS, Freeman GJ, Green JM, Thompson CB, Bluestone JA. CTLA-4 can function as a negative regulator of T cell activation. Immunity. 1994;1:405–413. - PubMed
    1. Tivol EA, Borriello F, Schweitzer AN, Lynch WP, luestone JAB, Sharpe AH. Loss of CTLA-4 leads to massive lymphoproliferation and fatal multiorgan tissue destruction, revealing a critical negative regulatory role of CTLA-4. Immunity. 1995;3:541–547. - PubMed

Publication types

MeSH terms